Fig. 5.
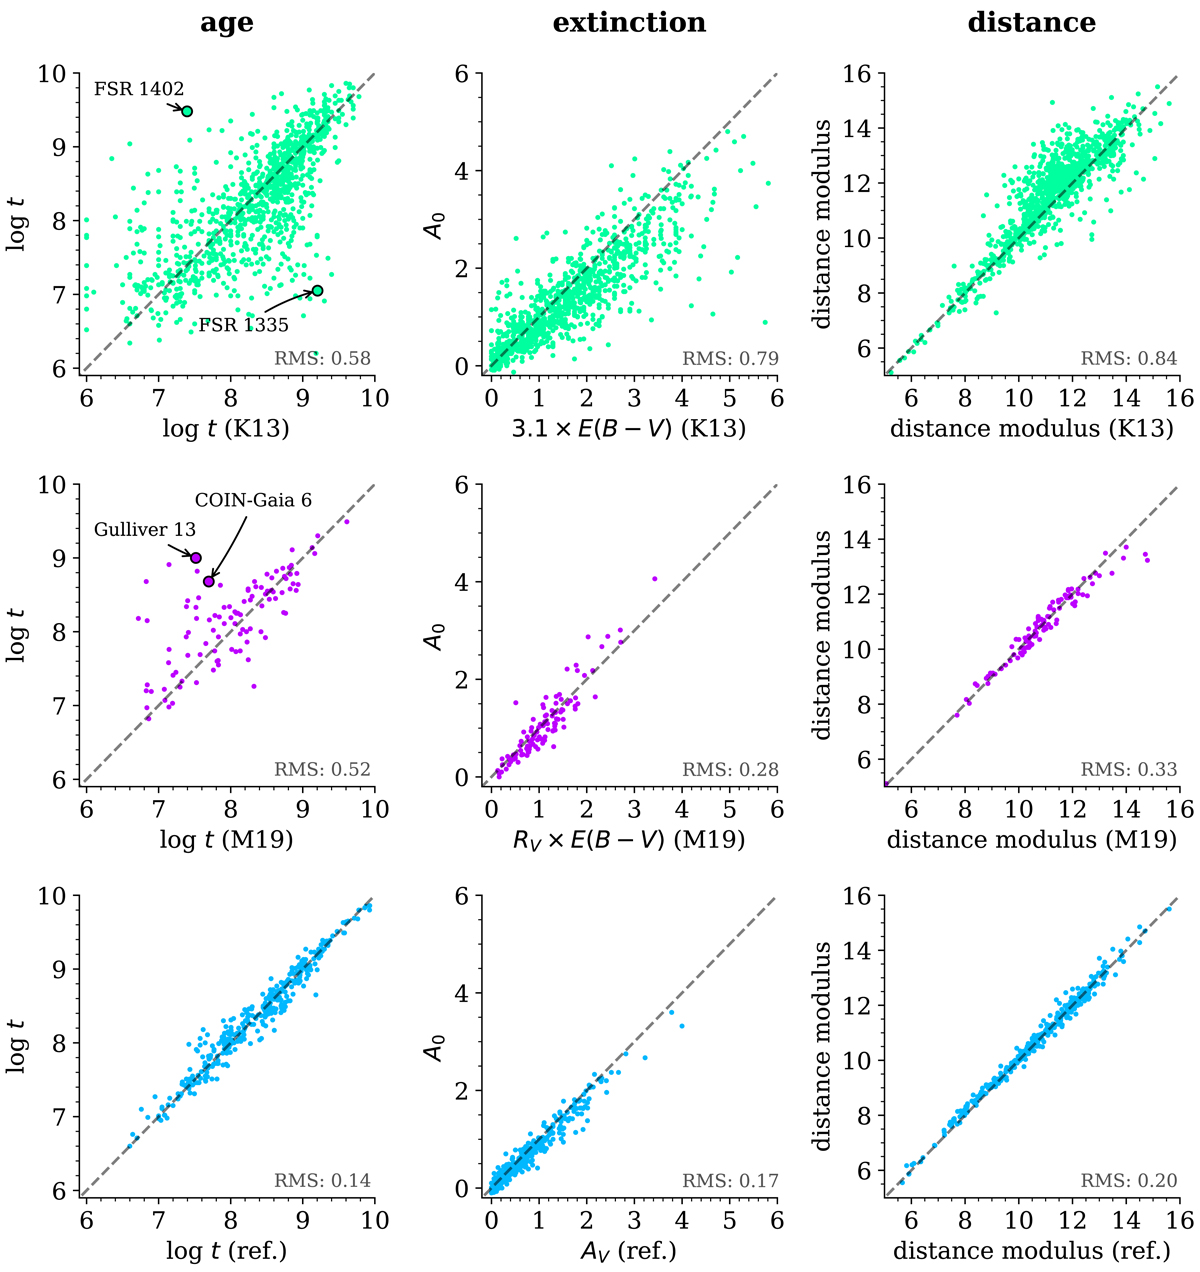
Top row: comparison of the parameters for the clusters in common with Kharchenko et al. (2013). Middle row: comparison of the parameters for the clusters in common with Monteiro & Dias (2019). The CMDs and isochrones for the labelled clusters are shown in Fig. 6. Bottom row: comparison between our ANN parameters and the literature references presented in Sect. 2.2. All panels display the root mean square (rms) difference.
Current usage metrics show cumulative count of Article Views (full-text article views including HTML views, PDF and ePub downloads, according to the available data) and Abstracts Views on Vision4Press platform.
Data correspond to usage on the plateform after 2015. The current usage metrics is available 48-96 hours after online publication and is updated daily on week days.
Initial download of the metrics may take a while.