Fig. 7.
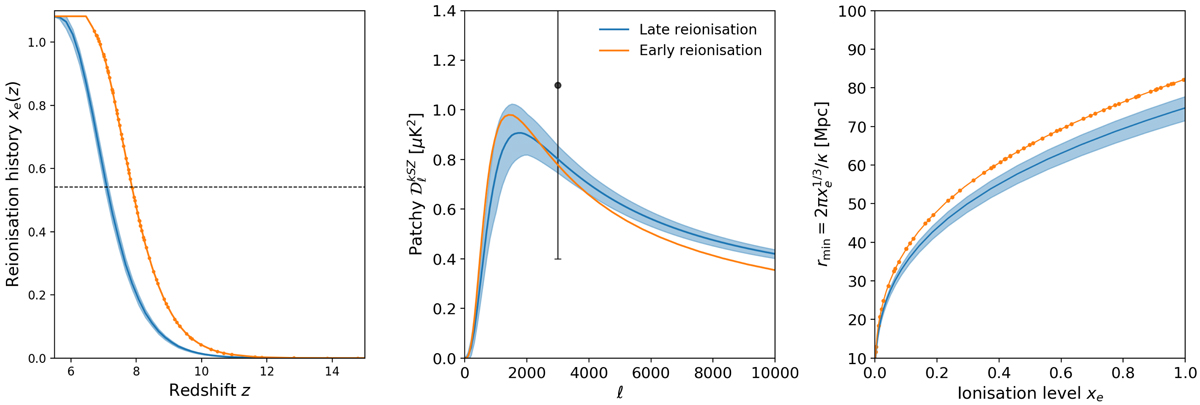
Comparison of results for our six initial simulations, corresponding to a late reionisation scenario, and for an additional seventh simulation, corresponding to an early reionisation scenario. Left panel: reionisation histories. Middle panel: patchy kSZ angular power spectra. The data point corresponds to constraints from Reichardt et al. (2020). Right panel: minimal size of ionised regions as a function of global ionised level. Shaded areas correspond to the 68% confidence level on kSZ amplitude propagated from the probability distributions of the fit parameters.
Current usage metrics show cumulative count of Article Views (full-text article views including HTML views, PDF and ePub downloads, according to the available data) and Abstracts Views on Vision4Press platform.
Data correspond to usage on the plateform after 2015. The current usage metrics is available 48-96 hours after online publication and is updated daily on week days.
Initial download of the metrics may take a while.