Fig. 3.
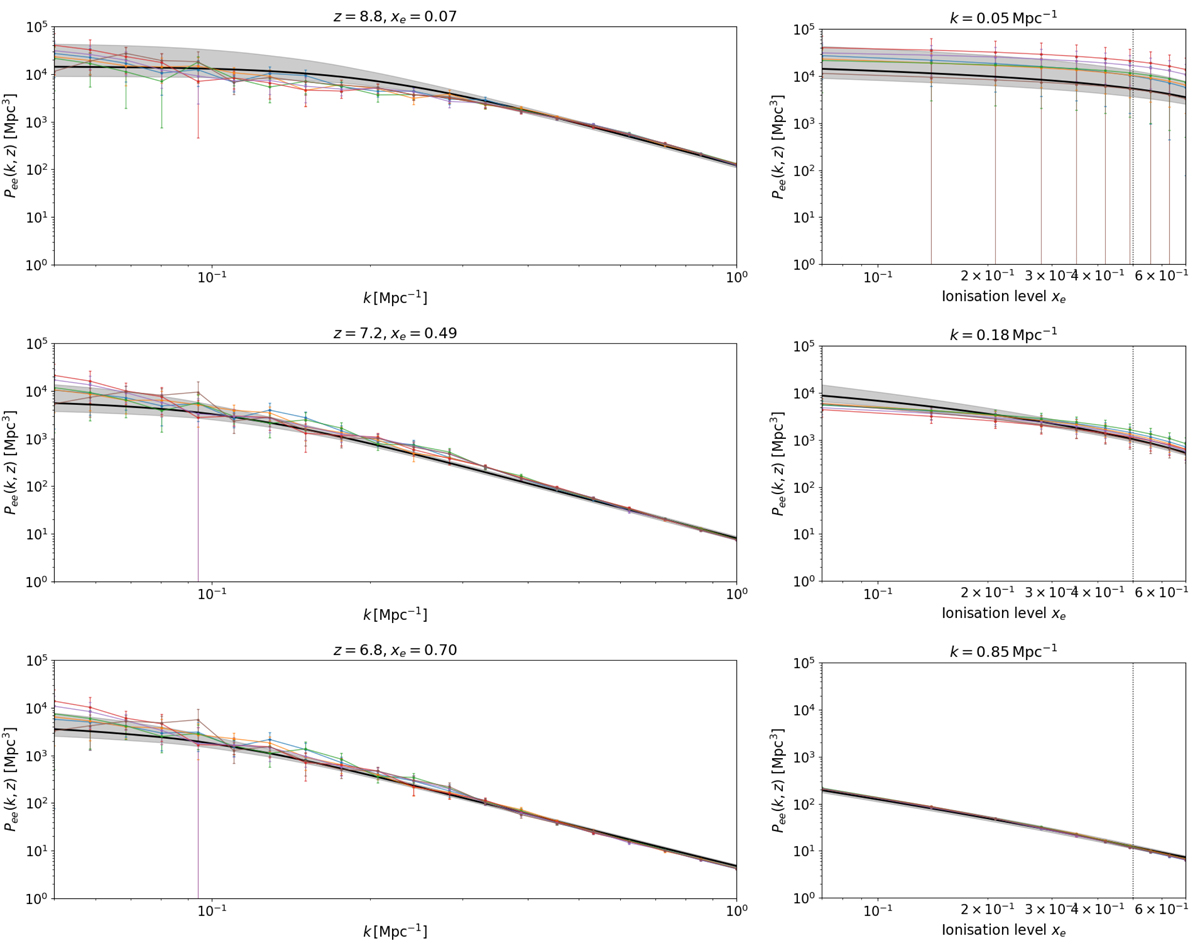
Result of the fit of Eq. (15) on the free electrons power spectrum of our six simulations, for three redshift bins (left panels) and three scale bins (right panels). The best-fit is shown as the thick black line with the accompanying 68% confidence interval, and the spectra of the six simulations as thin coloured lines. Error bars on data points are computed from the covariance matrix (see text for details).
Current usage metrics show cumulative count of Article Views (full-text article views including HTML views, PDF and ePub downloads, according to the available data) and Abstracts Views on Vision4Press platform.
Data correspond to usage on the plateform after 2015. The current usage metrics is available 48-96 hours after online publication and is updated daily on week days.
Initial download of the metrics may take a while.