Fig. 9
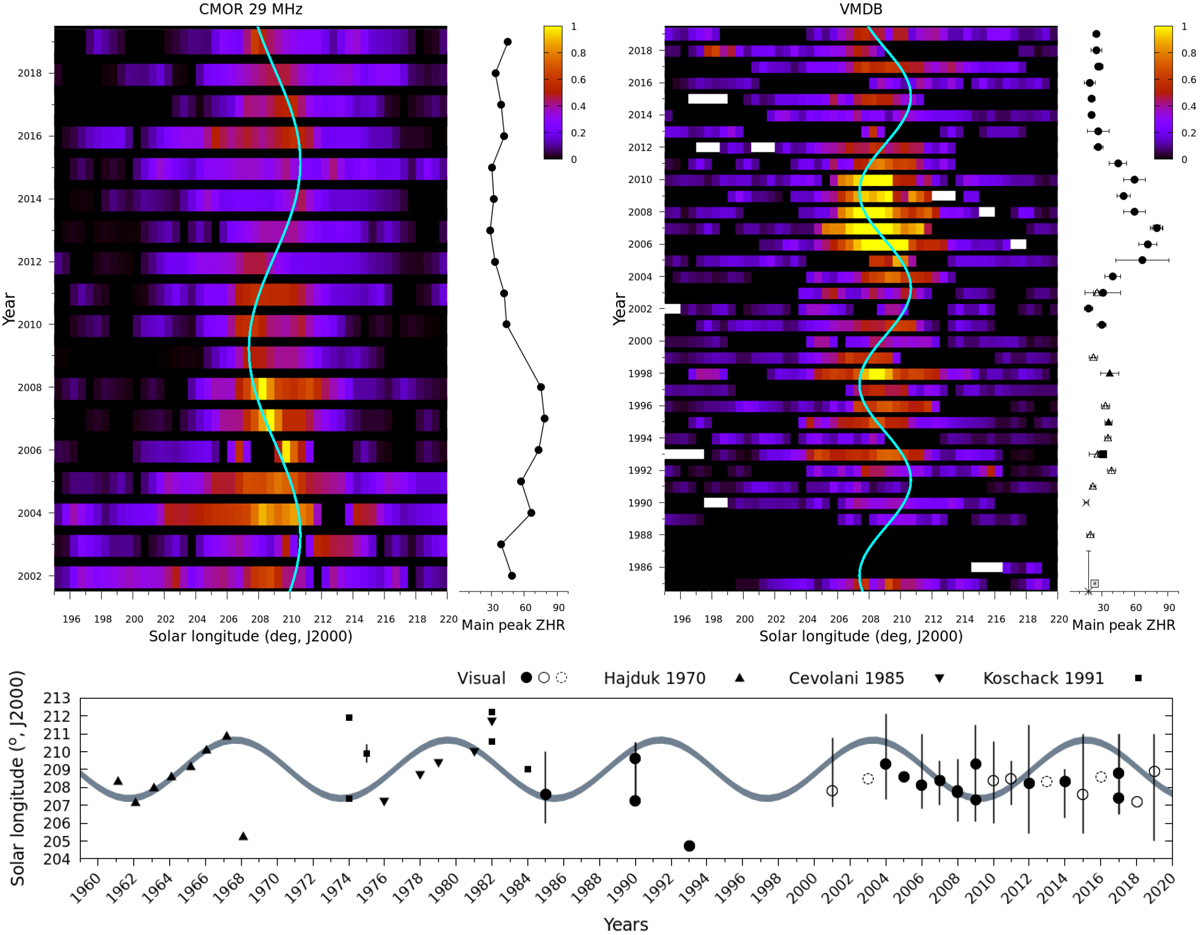
Top: intensity maps of the Orionids as measured by CMOR 29 MHz (left) and from visual observations (right). Here individual profiles were normalized by the maximum ZHRv ever recorded by the network, and not by the maximum ZHRv of a particular apparition. The modeled sinusoidal curve, best fit of Fig. 8, is presented in cyan. Bottom plot: comparison of the same modeled solar longitude variation (gray) as shown in the top plot, but now compared to the visual observations of Table D.2 (empty and filled circles) and including radar observations of Hajduk (1970; triangle, since 1960), Hajduk et al. (1984) and Cevolani & Hajduk (1985; inverse triangle), and complementary observationssummarized in Koschack & Roggemans (1991; square before1985).
Current usage metrics show cumulative count of Article Views (full-text article views including HTML views, PDF and ePub downloads, according to the available data) and Abstracts Views on Vision4Press platform.
Data correspond to usage on the plateform after 2015. The current usage metrics is available 48-96 hours after online publication and is updated daily on week days.
Initial download of the metrics may take a while.