Fig. 8
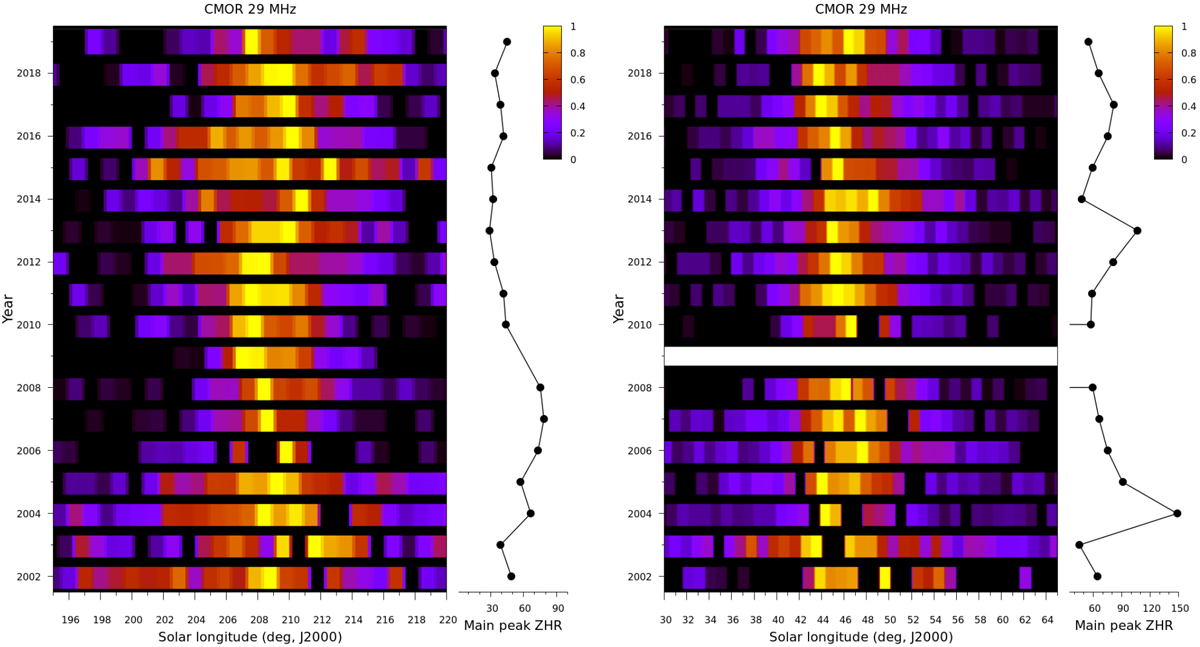
Intensity maps of the normalized Orionids (left) and η-Aquariids (right) activity as measured by the CMOR 29 MHz system since 2002. For each apparition of the shower, the activity profiles of Figs. B.2 and B.1 are normalized by the maximum ZHRv value determined in the previous section. This is represented by the black curve to the right of each map. Timing of maximum activity are highlighted by light colors (yellow to orange), while low meteor rates (or the absence of measurements) are represented by dark colors (purple to black).
Current usage metrics show cumulative count of Article Views (full-text article views including HTML views, PDF and ePub downloads, according to the available data) and Abstracts Views on Vision4Press platform.
Data correspond to usage on the plateform after 2015. The current usage metrics is available 48-96 hours after online publication and is updated daily on week days.
Initial download of the metrics may take a while.