Fig. 6
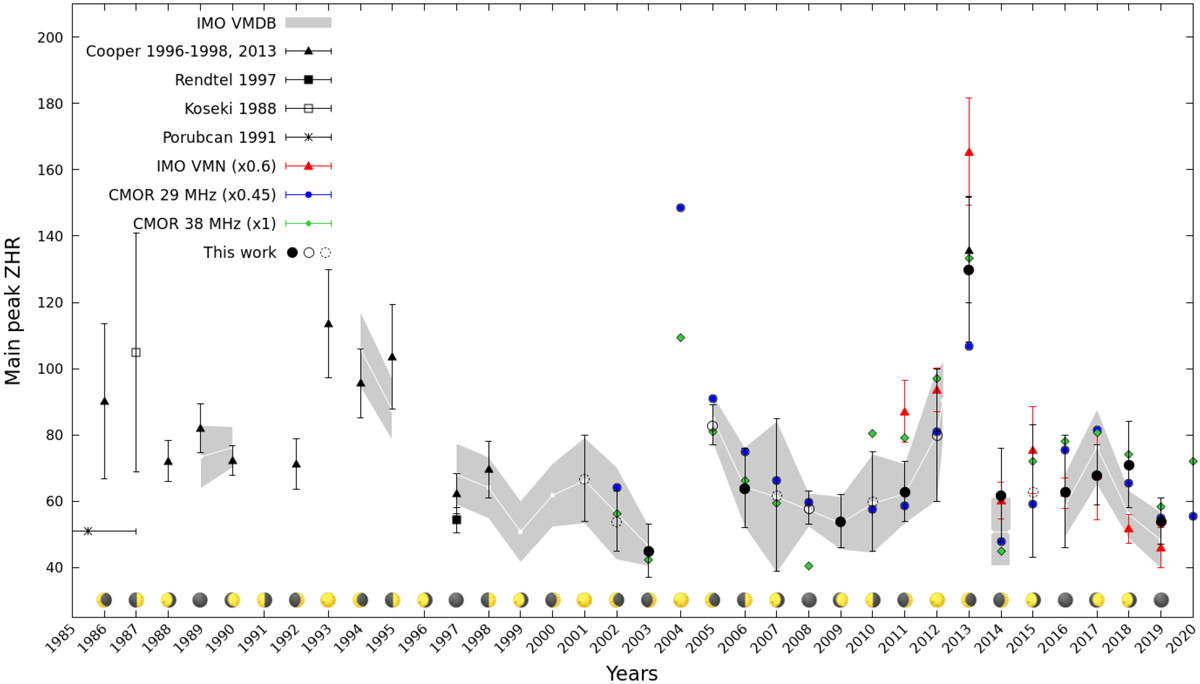
Annual variation of the η-Aquariids main peak (ZHRv) between 1985 and 2019. The maximum rates recorded by CMOR 29 (blue) and 38 MHz (green) are plotted along with the results of the VMN system (in red). Gray, black, and empty symbols refer to the maximum ZHRv deduced from visual observations. The new analysis of the IMO VMDB observations since 2001 is characterized by circles of different colors depending on the reliability of the peak observations (filled: reliable estimate, empty: uncertain value, empty and dashed: very uncertain estimate). The gray filled curve represents the approximate ZHRv maximum and uncertainty from the directly available online VMDB profiles (with no rigorous processing of the data). Additional measurements (especially before 2001) refer to previous publications. Horizontal error bars imply an average estimate of the maximum (ZHRv) over the indicated period. The bottom symbols represent the phase of the moon around the estimated main peak date. More information is given in the text.
Current usage metrics show cumulative count of Article Views (full-text article views including HTML views, PDF and ePub downloads, according to the available data) and Abstracts Views on Vision4Press platform.
Data correspond to usage on the plateform after 2015. The current usage metrics is available 48-96 hours after online publication and is updated daily on week days.
Initial download of the metrics may take a while.