Fig. C.1
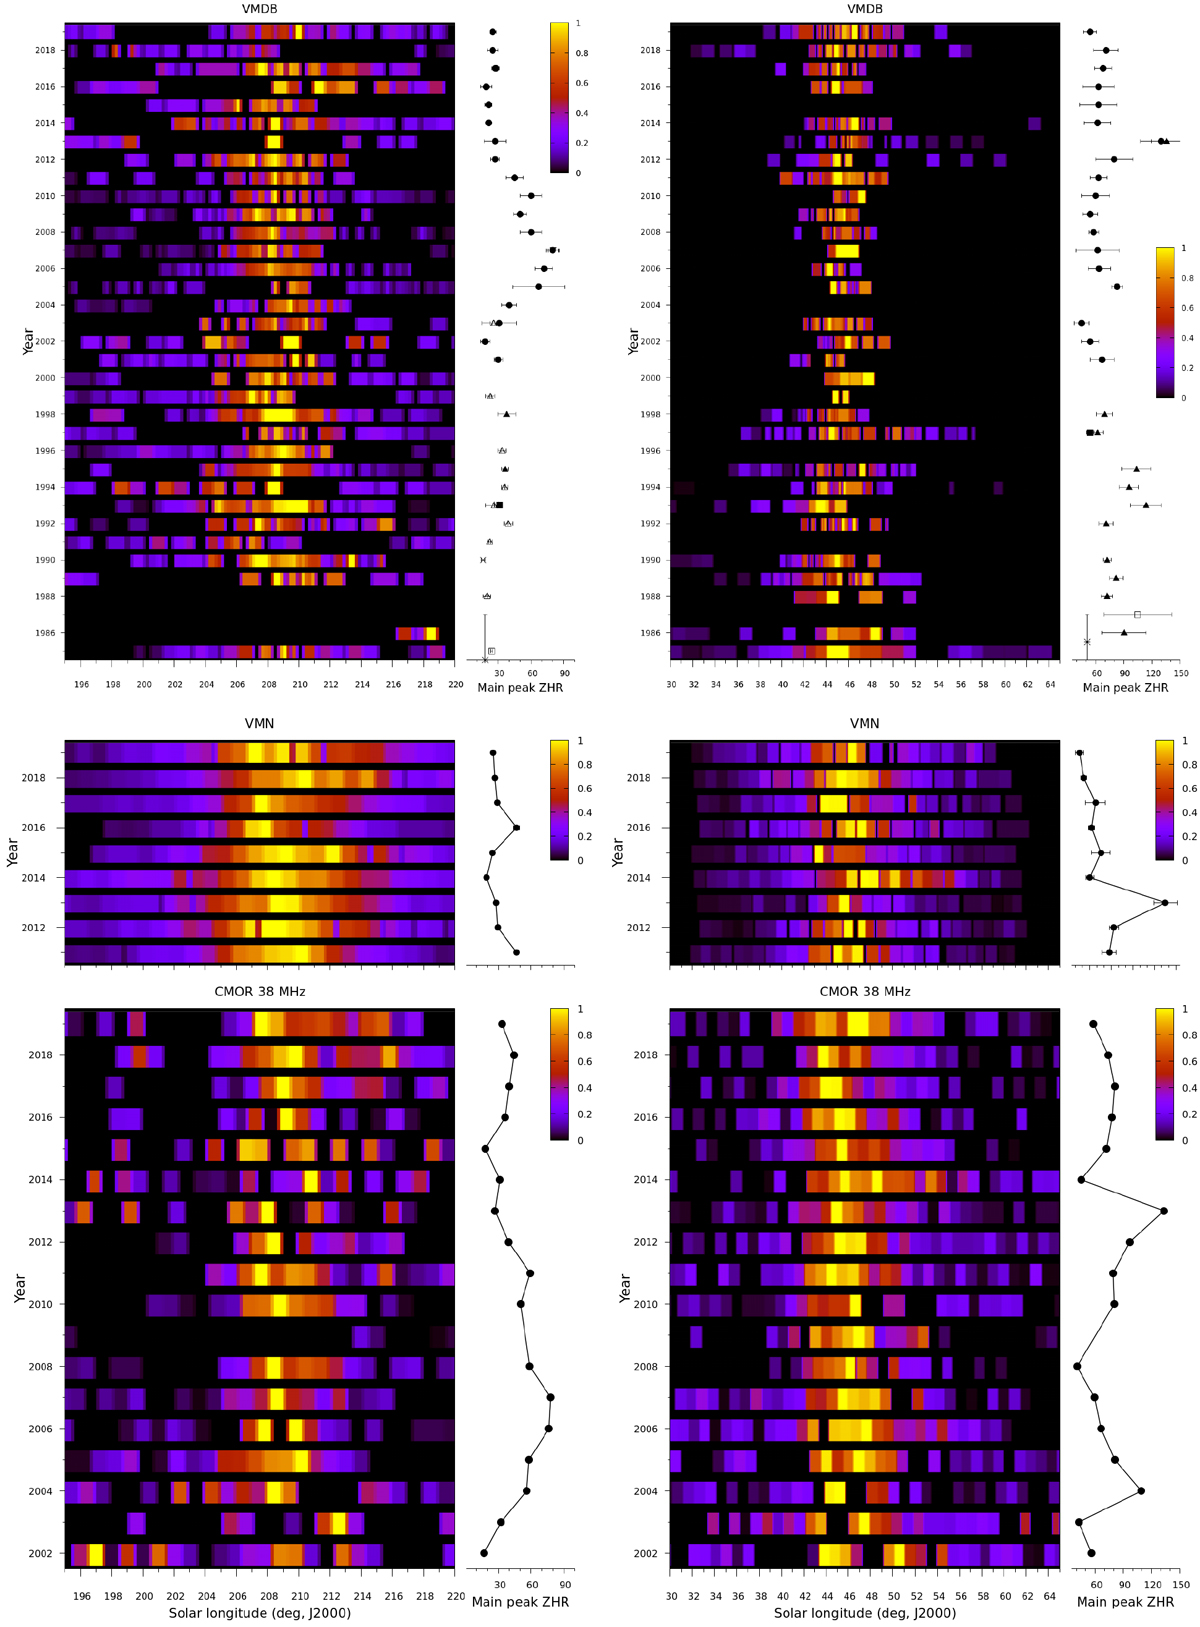
VMDB (top), VMN (middle), and CMOR 38 MHz (bottom) intensity maps of the Orionids (left) and η-Aquariids (right). For each apparition of the shower presented in Appendices A and B, the activity profile is normalized by the corresponding maximum ZHR determined in Sect. 6.3.1 (reminded by the black curve at the right of the map).
Current usage metrics show cumulative count of Article Views (full-text article views including HTML views, PDF and ePub downloads, according to the available data) and Abstracts Views on Vision4Press platform.
Data correspond to usage on the plateform after 2015. The current usage metrics is available 48-96 hours after online publication and is updated daily on week days.
Initial download of the metrics may take a while.