Fig. 6
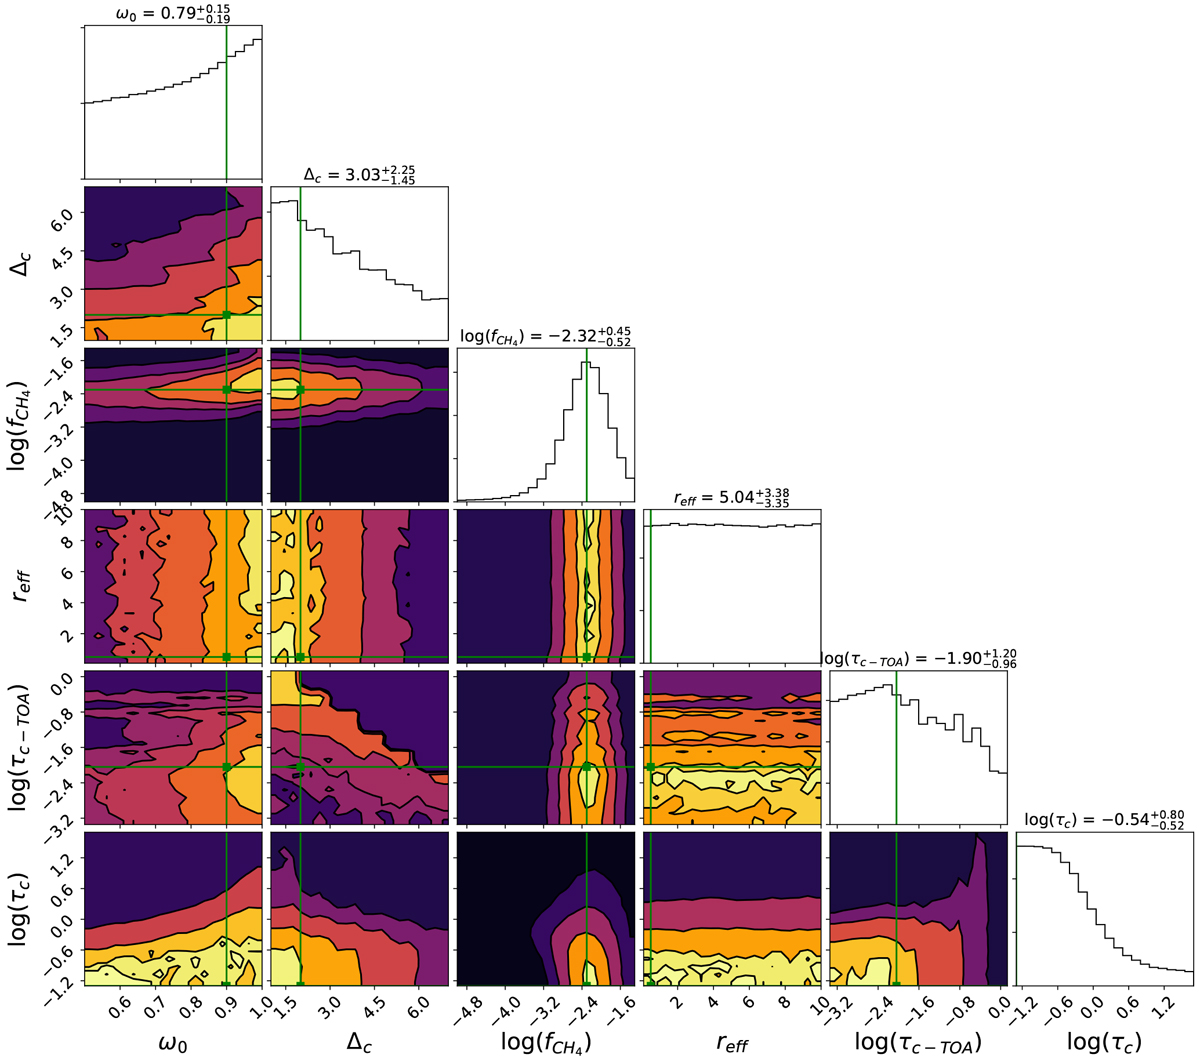
Posterior probability distributions of the model parameters for a simulated observation of the no-cloud atmospheric configuration at S∕N = 10. The planetary radius is assumed to be known and Rp∕RN = 0.6. Green lines mark the true values of the model parameters (see Table 2) for this observation. Two-dimensional subplots show the correlations between pairs of parameters. Contour lines correspond to the 0.5, 1, 1.5, and 2σ levels. The median of each parameter’s distribution is shown on top of their 1D probability histogram. Upper and lower uncertainties correspond to the 84 and 16% quantiles. The figures corresponding to the other scenarios discussed in Sects. 4.1 and 4.2 are shown in Appendix B.
Current usage metrics show cumulative count of Article Views (full-text article views including HTML views, PDF and ePub downloads, according to the available data) and Abstracts Views on Vision4Press platform.
Data correspond to usage on the plateform after 2015. The current usage metrics is available 48-96 hours after online publication and is updated daily on week days.
Initial download of the metrics may take a while.