Fig. 5
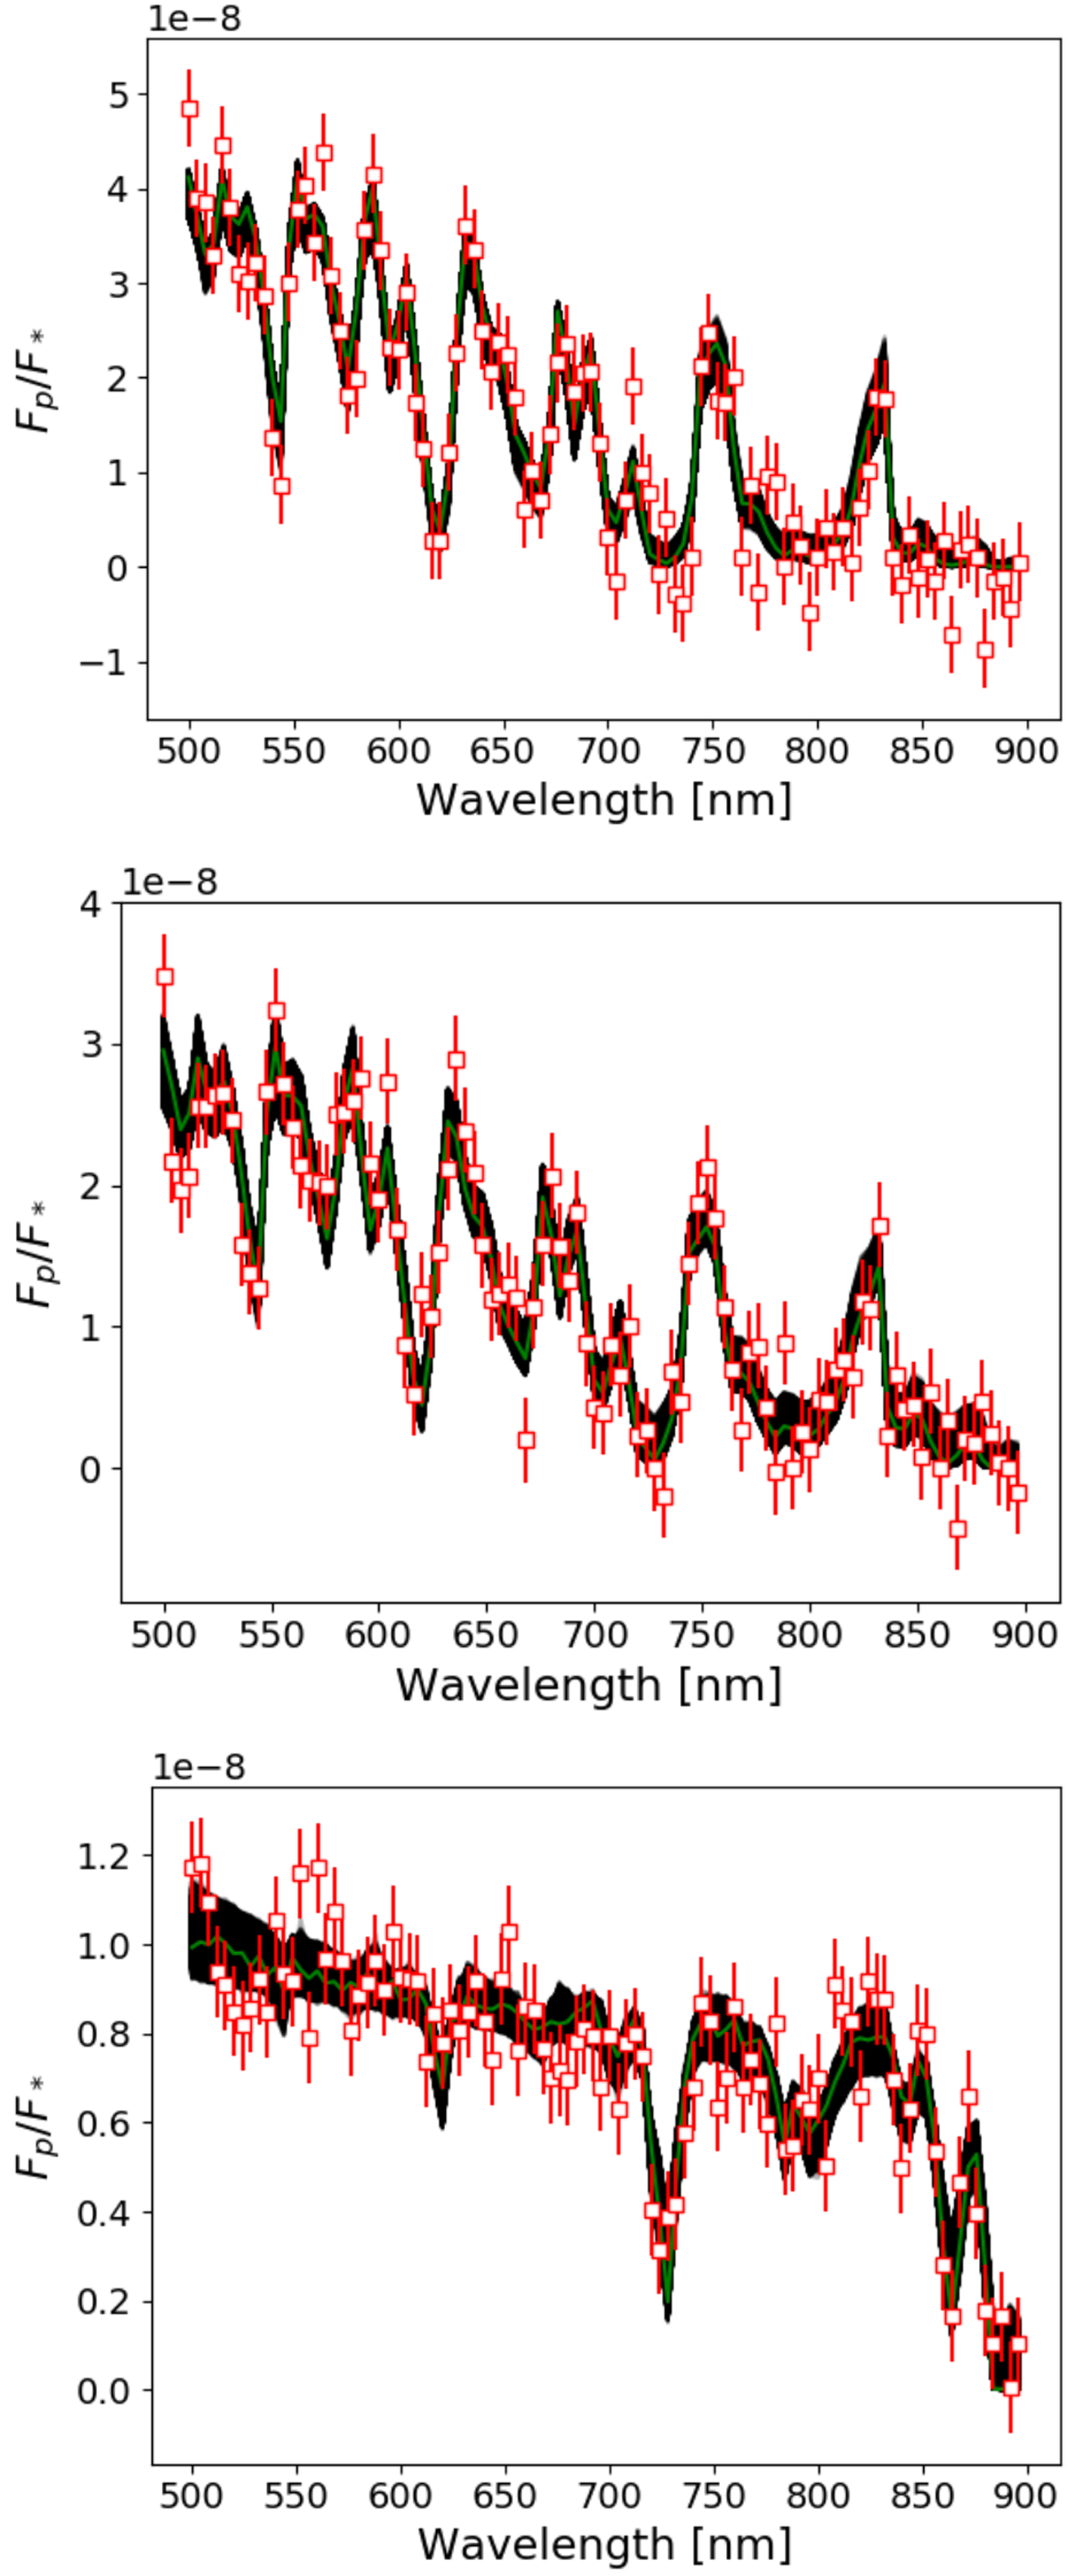
Solid green line: true spectrum for the true atmospheric configuration. Red symbols: simulated measured spectrum, with error bars corresponding to S∕N = 10. Solid black lines: synthetic spectra that meet the condition Δχ2 < 15.1, generated during the MCMC retrieval for a known Rp. Top: no-cloud configuration; middle: thin-cloud; bottom: thick-cloud.
Current usage metrics show cumulative count of Article Views (full-text article views including HTML views, PDF and ePub downloads, according to the available data) and Abstracts Views on Vision4Press platform.
Data correspond to usage on the plateform after 2015. The current usage metrics is available 48-96 hours after online publication and is updated daily on week days.
Initial download of the metrics may take a while.