Fig. 4
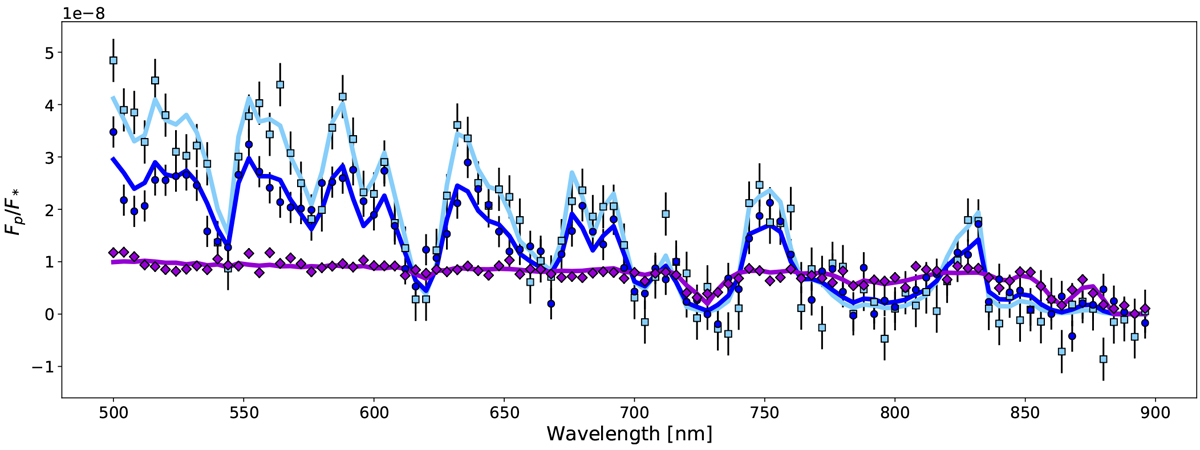
Solid lines: true (noiseless) spectra for the three atmospheric configurations in Table 2 at phase angle α = 0°. Symbols: corresponding measured spectra, with error bars specific to S∕N = 10. The size of the error bars (σm; see text) is defined on the basis of the brightest spectral bin (which typically occurs near 500 nm) and is the same at all wavelengths for each spectrum. The spectra correspond to no-cloud (light blue), thin-cloud (dark blue), and thick-cloud (purple) atmospheric configurations.
Current usage metrics show cumulative count of Article Views (full-text article views including HTML views, PDF and ePub downloads, according to the available data) and Abstracts Views on Vision4Press platform.
Data correspond to usage on the plateform after 2015. The current usage metrics is available 48-96 hours after online publication and is updated daily on week days.
Initial download of the metrics may take a while.