Fig. 3
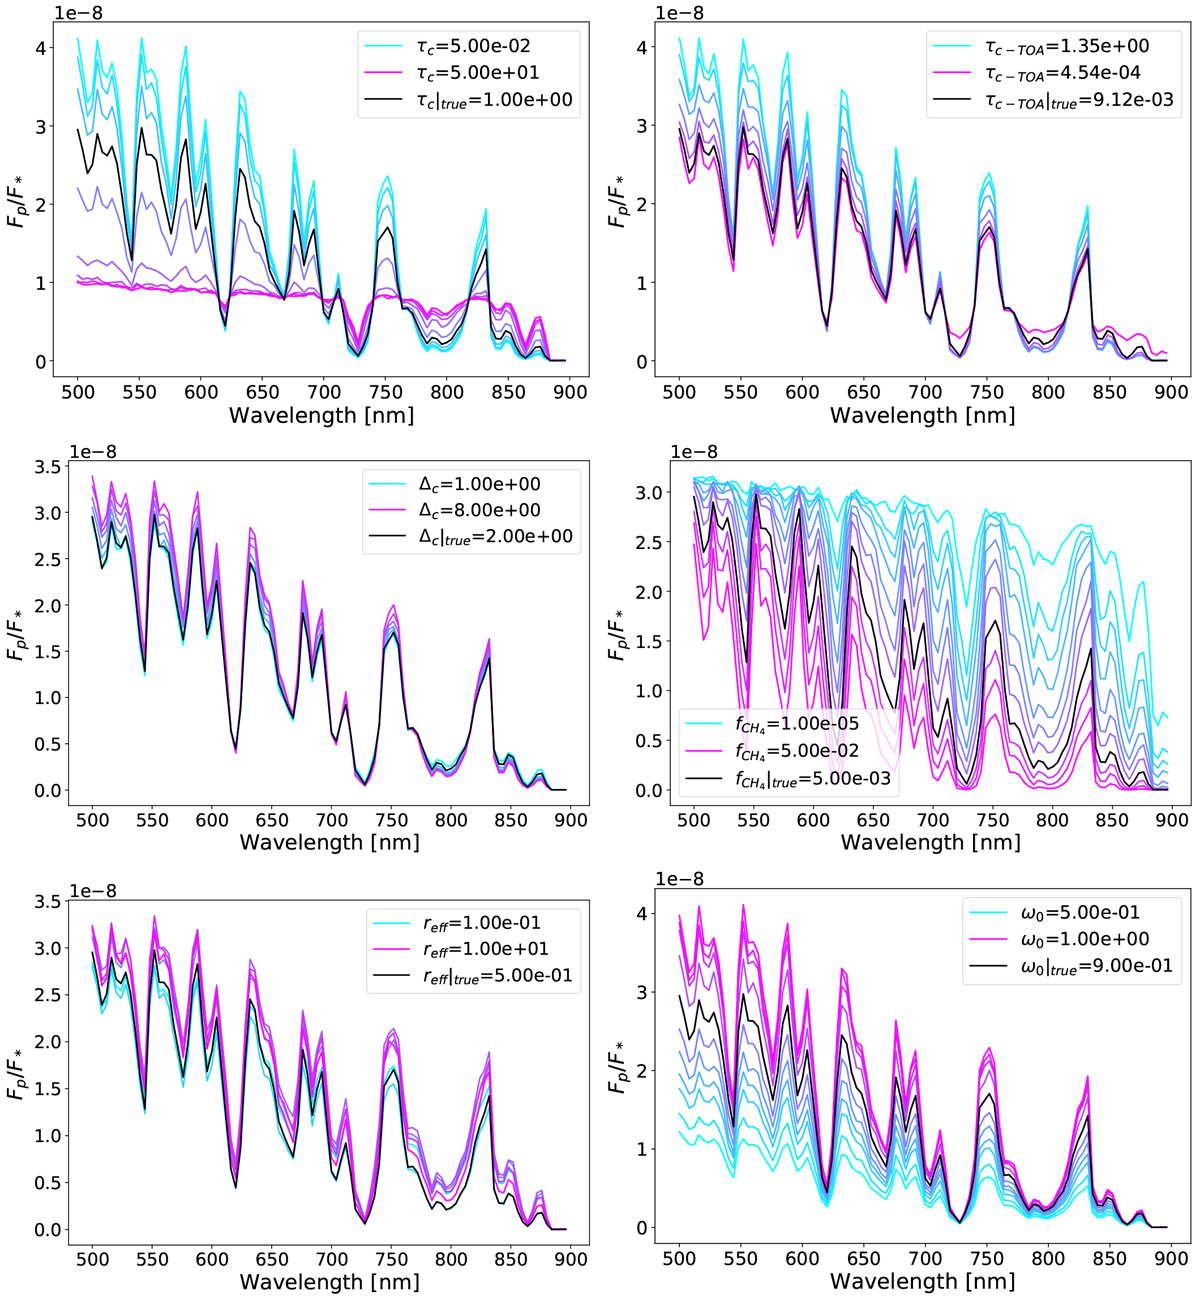
Solid black lines: synthetic spectra for the thin-cloud configuration (see Table 2). Coloured lines: synthetic spectra for the configurations that result from perturbing each of the elements of the six-dimensional atmospheric vector p = {τc, Δc, τc →TOA, reff, ω0,
![]() } one at a time and according to the values listed in Table 1. The colour code is described in the legends for the lowermost and uppermost values of each parameter, with the other colours corresponding to the intermediate parameter values. The value of Δc is given in Hg units and reff in μm.
} one at a time and according to the values listed in Table 1. The colour code is described in the legends for the lowermost and uppermost values of each parameter, with the other colours corresponding to the intermediate parameter values. The value of Δc is given in Hg units and reff in μm.
Current usage metrics show cumulative count of Article Views (full-text article views including HTML views, PDF and ePub downloads, according to the available data) and Abstracts Views on Vision4Press platform.
Data correspond to usage on the plateform after 2015. The current usage metrics is available 48-96 hours after online publication and is updated daily on week days.
Initial download of the metrics may take a while.