Fig. C.1
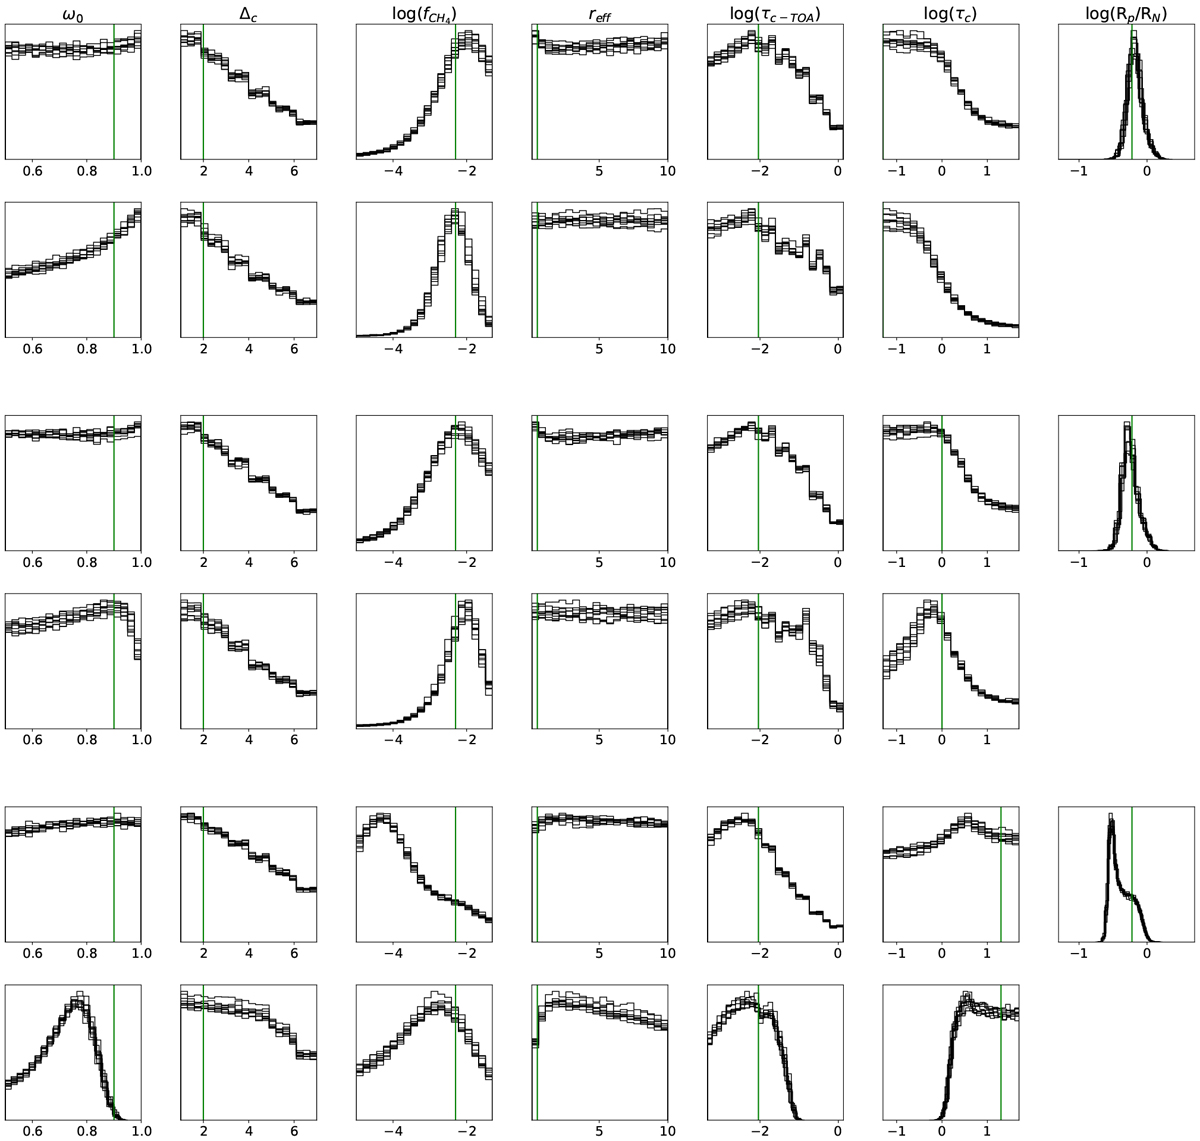
Solid black lines: marginalized probability distributions for each of the model parameters, given in each of the columns, after performing the retrievals ten times for as many different noise realizations of the measured spectra. Top rows: no-cloud scenario, both for Rp unknown and known. Middle rows: thin-cloud scenario, both for Rp unknown and known. Bottom rows: thick-cloud scenario, both for Rp unknown and known. Vertical green lines mark the true values of the model parameters (see Table 2) for each scenario.
Current usage metrics show cumulative count of Article Views (full-text article views including HTML views, PDF and ePub downloads, according to the available data) and Abstracts Views on Vision4Press platform.
Data correspond to usage on the plateform after 2015. The current usage metrics is available 48-96 hours after online publication and is updated daily on week days.
Initial download of the metrics may take a while.