Fig. A.1
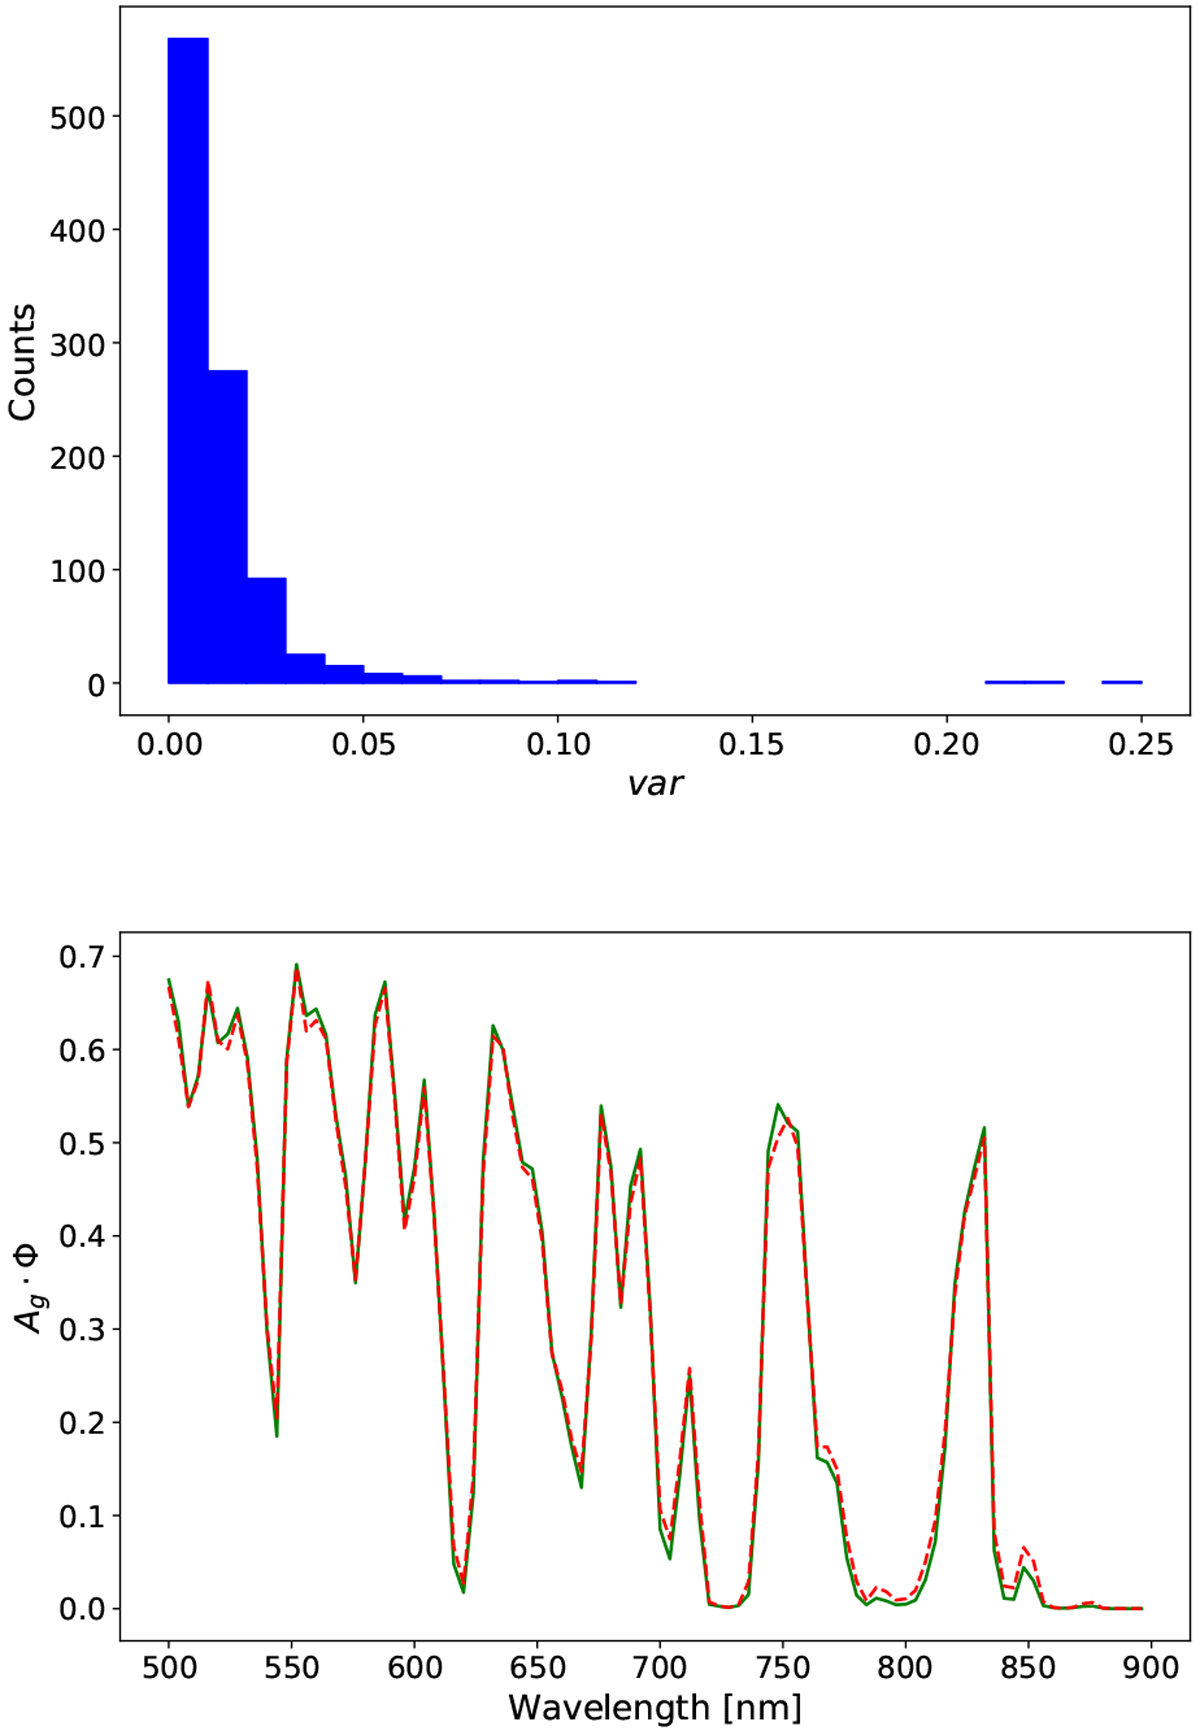
Top: distribution of var values for the 1000 random realizations selected to compare the planetary albedo obtained by solving the multiple scattering problem and that obtained by linear interpolation from the grid. Bottom: computed (solid green line) and interpolated (dashed red line) albedos for the configuration with the highest var value.
Current usage metrics show cumulative count of Article Views (full-text article views including HTML views, PDF and ePub downloads, according to the available data) and Abstracts Views on Vision4Press platform.
Data correspond to usage on the plateform after 2015. The current usage metrics is available 48-96 hours after online publication and is updated daily on week days.
Initial download of the metrics may take a while.