Fig. 9
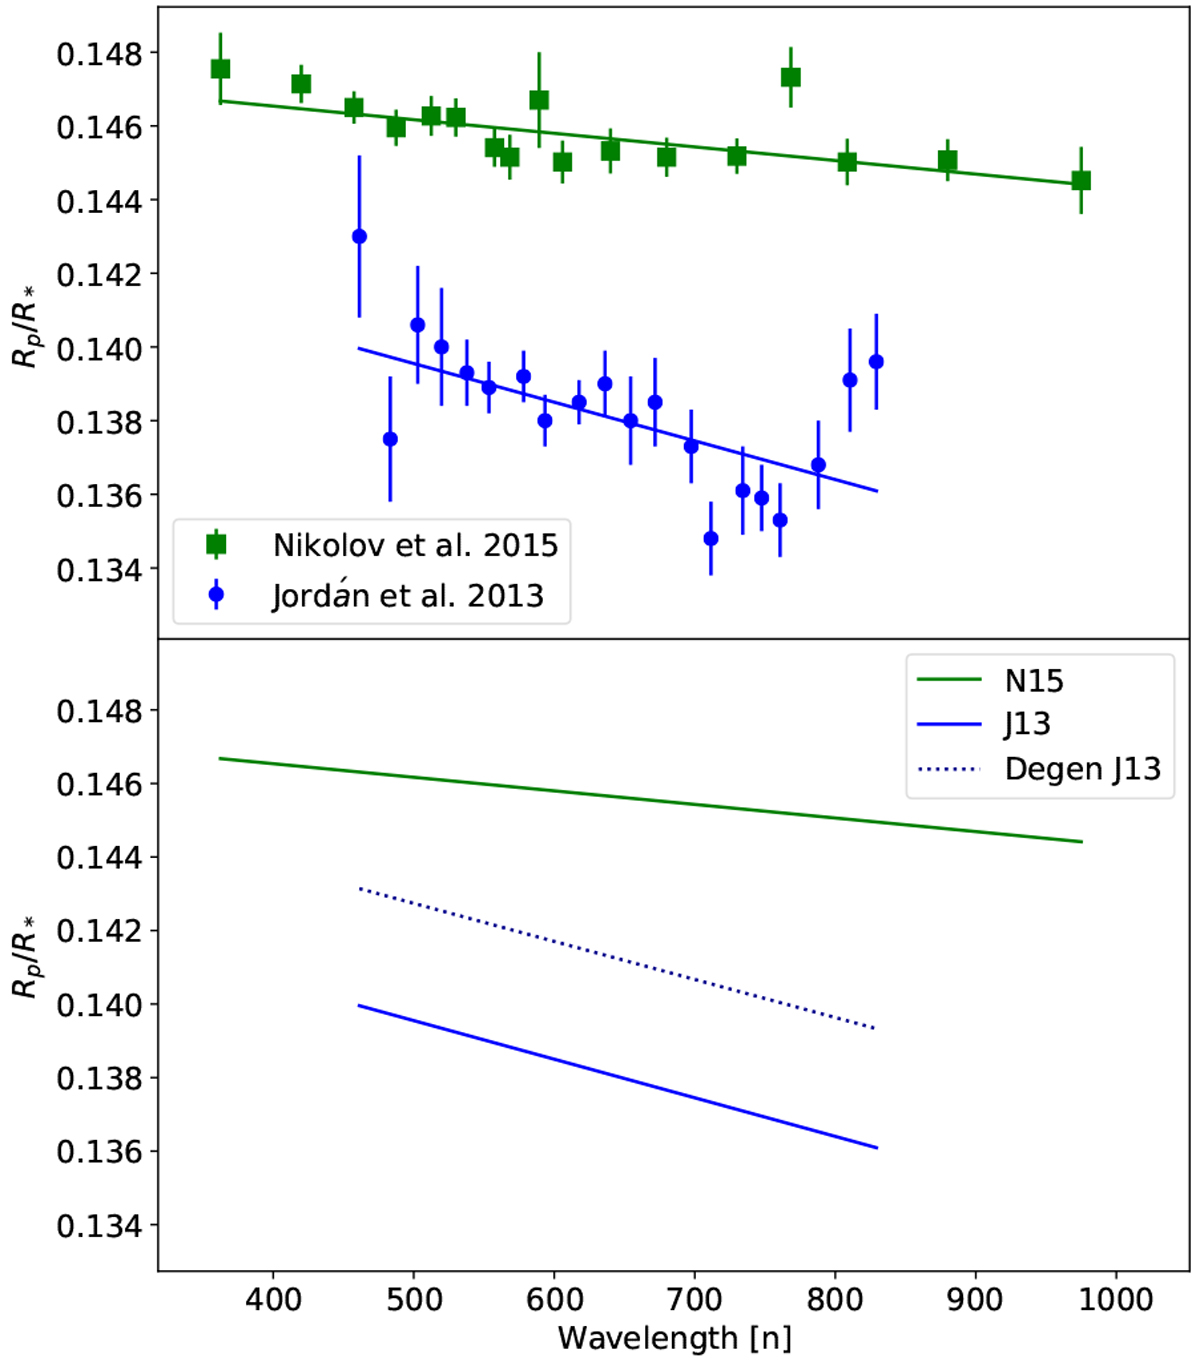
WASP-6b transmission spectra (upper panel) of N15 and J13 as green squares and blue dots, respectively, along with the solid green line and solid blue line as regression line fits to these datasets. Synthetic light curves of J13 (lower panel) with parameters that yield the impact parameter of N15. The contribution of this degeneracy to J13 is shown with a dotted blue line.
Current usage metrics show cumulative count of Article Views (full-text article views including HTML views, PDF and ePub downloads, according to the available data) and Abstracts Views on Vision4Press platform.
Data correspond to usage on the plateform after 2015. The current usage metrics is available 48-96 hours after online publication and is updated daily on week days.
Initial download of the metrics may take a while.