Fig. 8
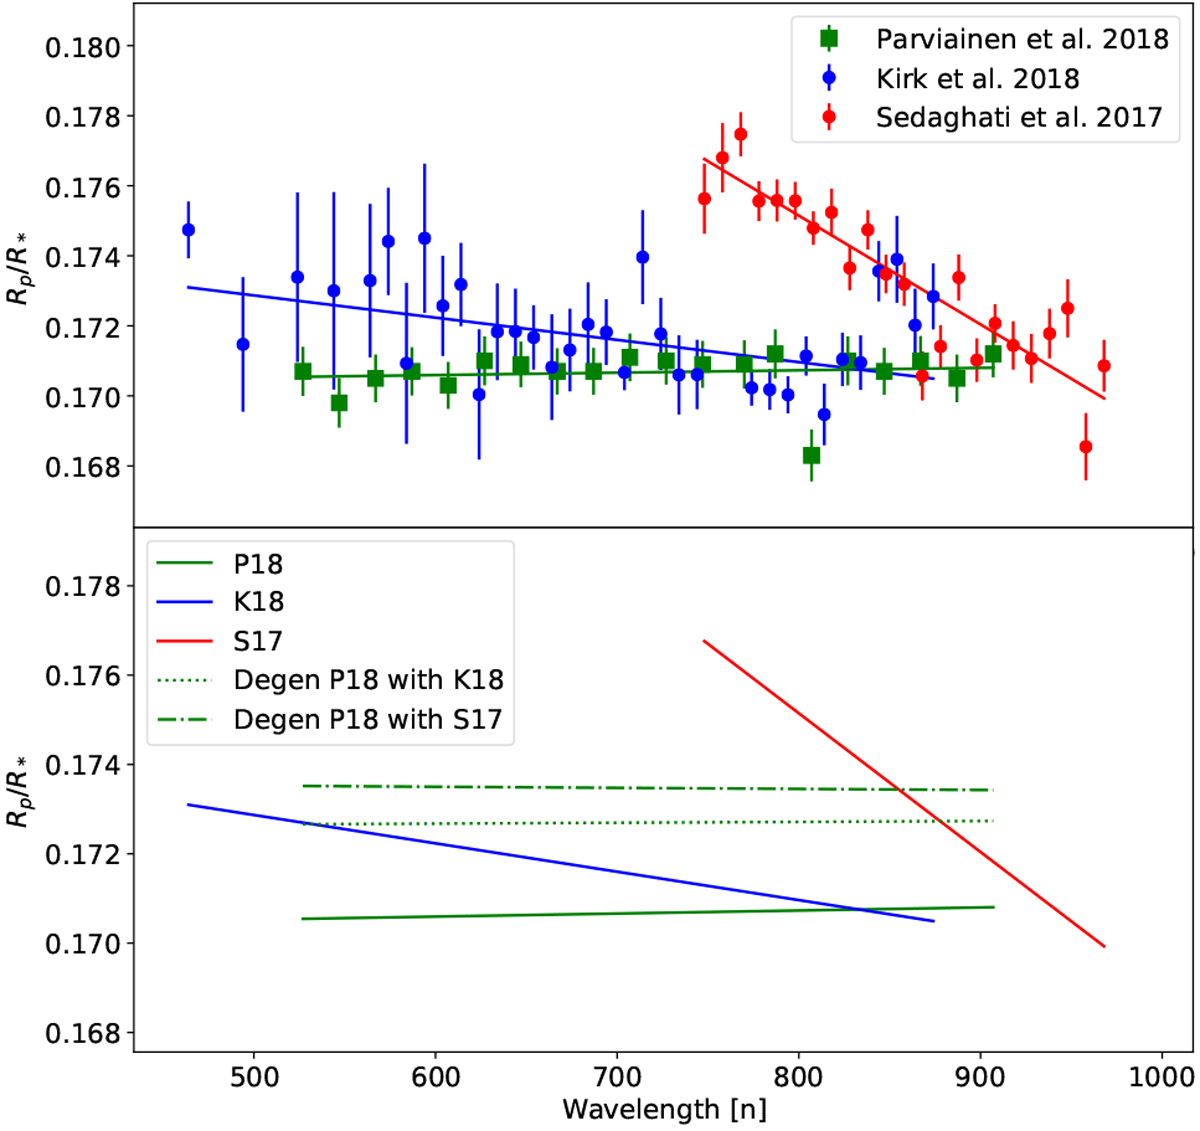
Spectral slopes from transmission spectroscopy investigations on WASP-80b by three individual groups (upper panel; P18 as green squares, K18 as blue dots, and S17 as red dots). The corresponding solid lines are regression line fits toeach dataset. Synthetic light curves fit (lower panel) based on the parameters of P18 with transit models using the parameterization from K18 and S17, which yield different impact parameters than P18. The dotted green and dash-dotted green lines show the impact parameter degeneracy applied to the slope of P18, using the b terms from K18 and S17, respectively.
Current usage metrics show cumulative count of Article Views (full-text article views including HTML views, PDF and ePub downloads, according to the available data) and Abstracts Views on Vision4Press platform.
Data correspond to usage on the plateform after 2015. The current usage metrics is available 48-96 hours after online publication and is updated daily on week days.
Initial download of the metrics may take a while.