Fig. 5
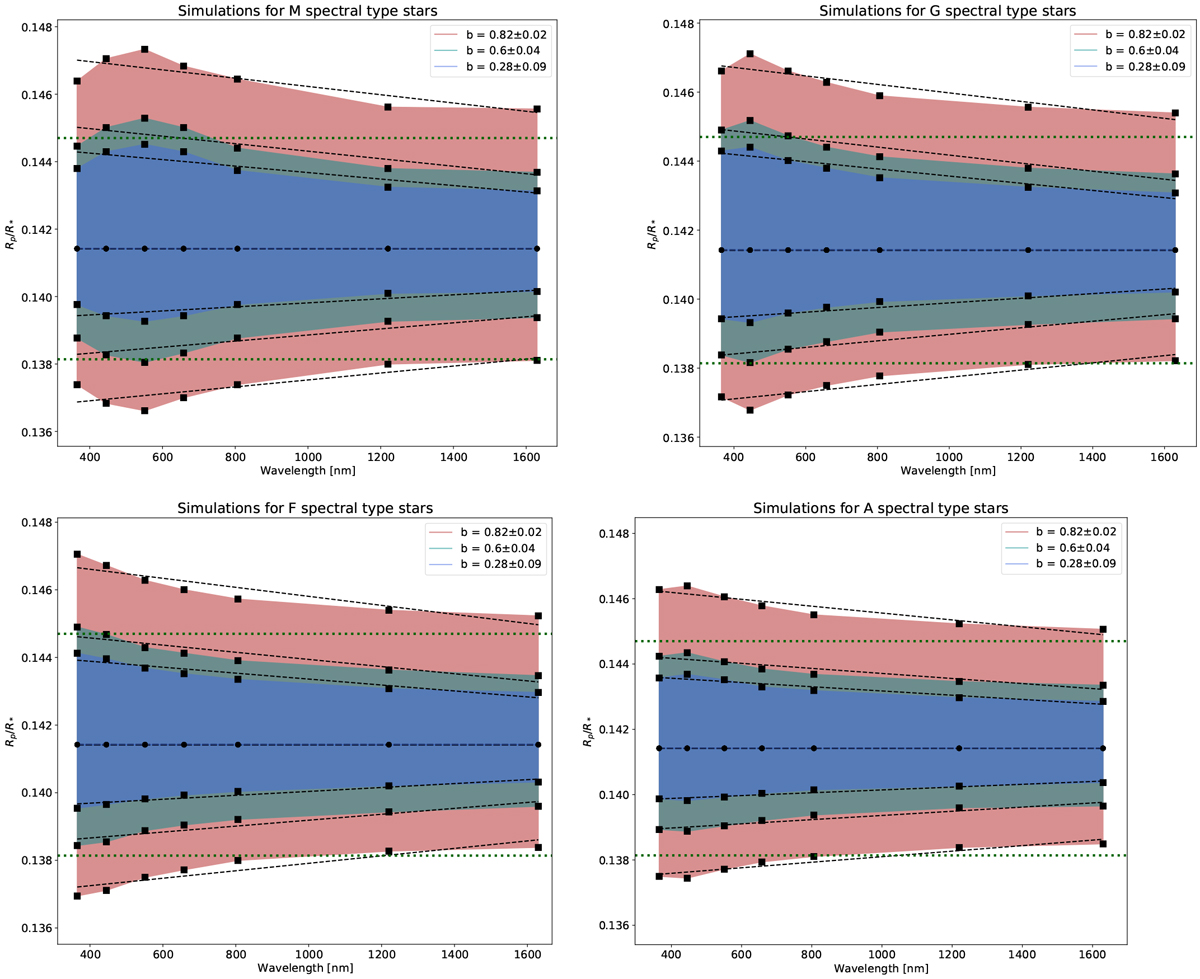
Simulations of variations that are due to the impact parameter degeneracy in the transmission spectra of the three different subgroups of exoplanets (groups A, B, and C), orbiting different categories of host stars. Upper panels: M- (on the left) and G- (on the right) and lower panels: F- (on the left) and A-type stars (on the right). The black dots indicate the flat synthetic spectra of each subgroup that we created with those configurations of the orbital parameters that yielded the median b value for each case. A combination of the orbital parameters at the transit model fit yields the spectra based on the change of ± Δb for each subgroup; this is indicated with black squares. The colored areas represent the error envelope. Dashed black lines show the linear regression fits on each spectrum, and the dotted green lines indicate two atmospheric scale heights from the average Rp ∕Rs value, as defined from the original setup for the transit depth.
Current usage metrics show cumulative count of Article Views (full-text article views including HTML views, PDF and ePub downloads, according to the available data) and Abstracts Views on Vision4Press platform.
Data correspond to usage on the plateform after 2015. The current usage metrics is available 48-96 hours after online publication and is updated daily on week days.
Initial download of the metrics may take a while.