Fig. 4
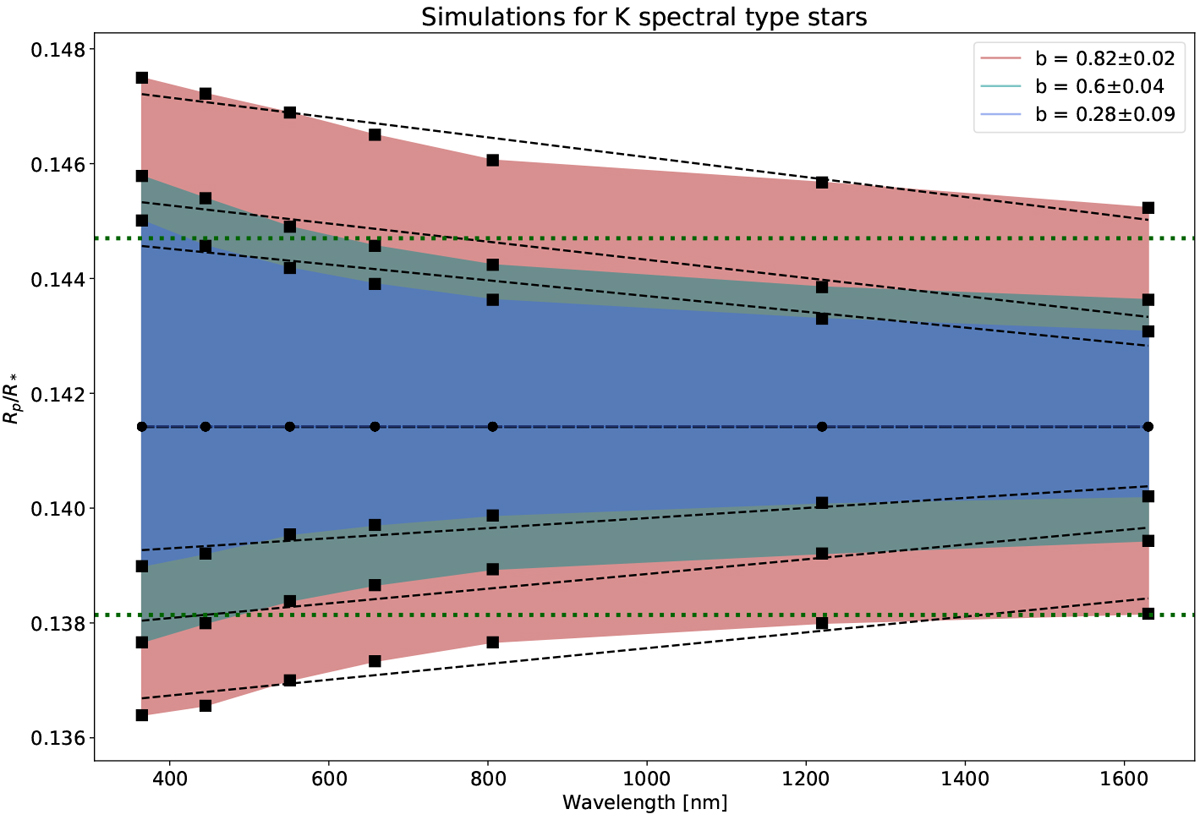
Effect of b ± Δb on the transmission spectra of three different groups of exoplanets (groups A, B and C), showing an introduced slope and an offset for different b values. Black dots show the synthetic spectra of each subgroup, and black squares show the respective derived spectra with the variationin b. The colored areas illustrate the error envelope for each case. Dashed black lines show the linear regression fits on each spectrum, and dotted green lines indicate two atmospheric scale heights from the predefined input value for Rp ∕Rs.
Current usage metrics show cumulative count of Article Views (full-text article views including HTML views, PDF and ePub downloads, according to the available data) and Abstracts Views on Vision4Press platform.
Data correspond to usage on the plateform after 2015. The current usage metrics is available 48-96 hours after online publication and is updated daily on week days.
Initial download of the metrics may take a while.