Fig. 9
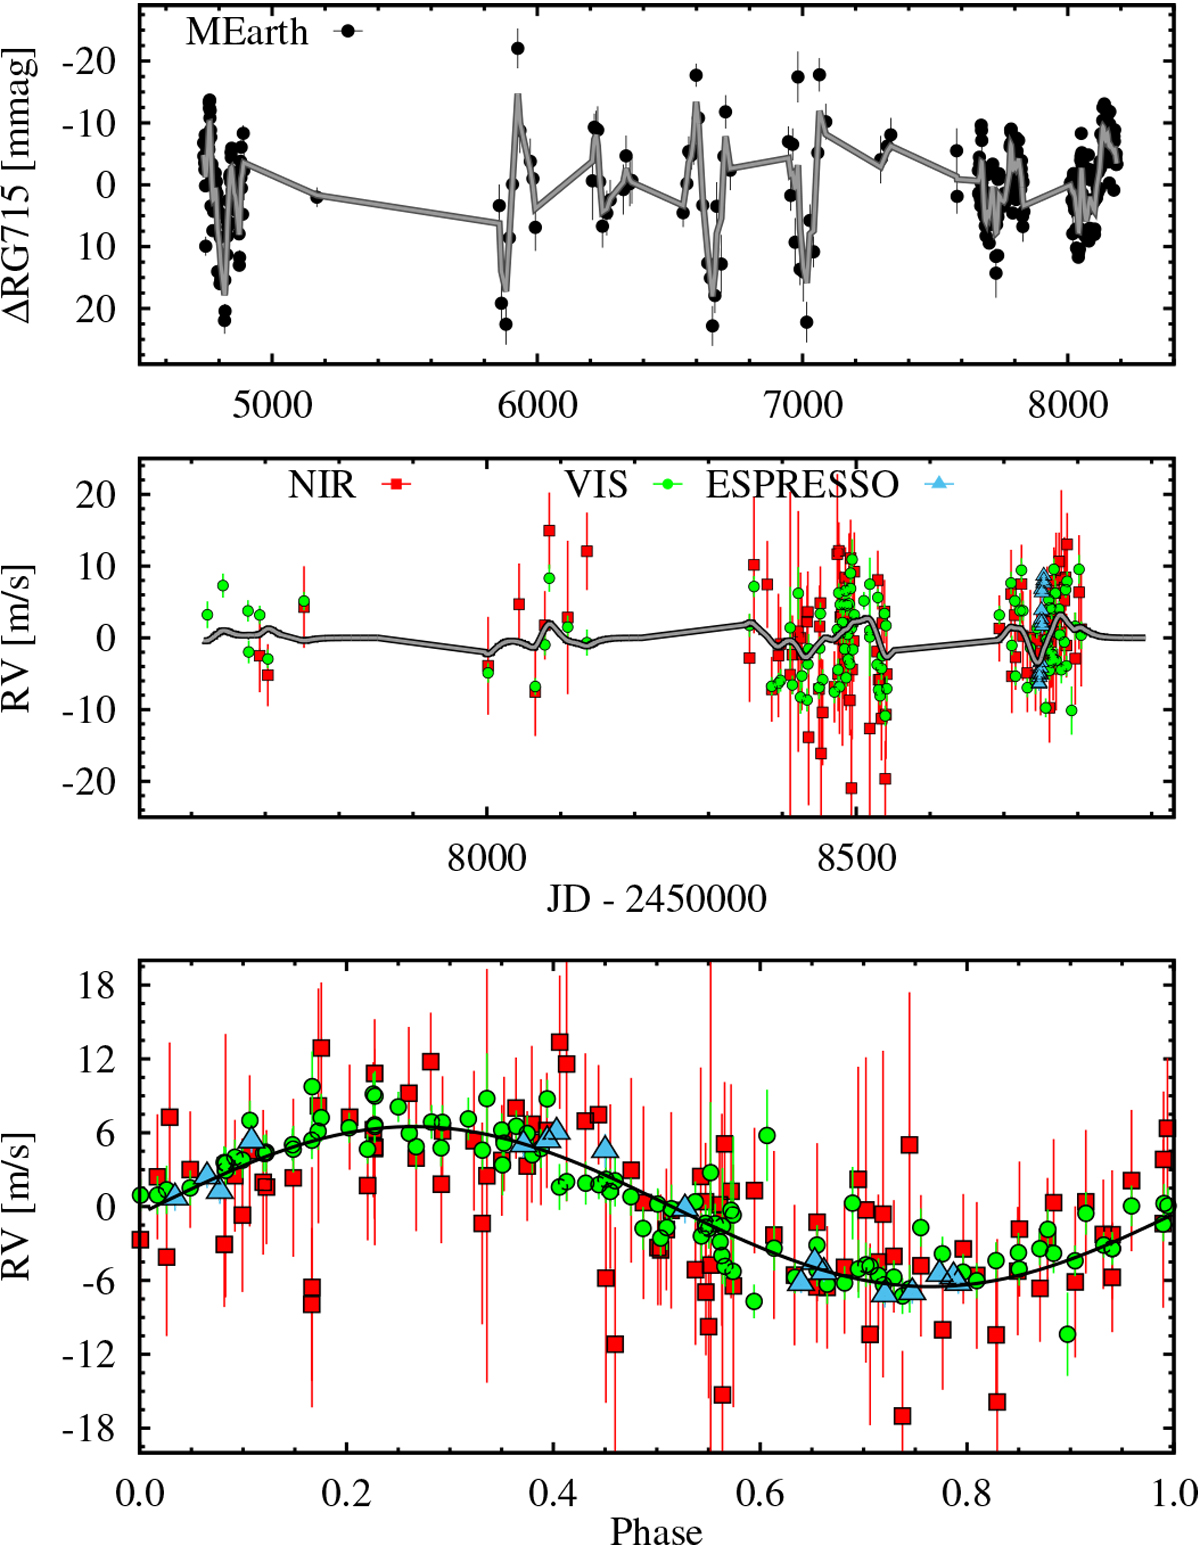
Combined analysis of photometry and RV. Top panel: MEarth photometry (black points) and GP fit (gray line). Middle panel: RV time series of the VIS channel (green points), the NIR channel (red squares), ESPRESSO (blue triangles), and GP fit with Matern kernel (gray line). Bottom panel: activity-subtracted RVs folded to the Keplerian period Pb = 2.2907 d and best-fit circular orbit (black line).
Current usage metrics show cumulative count of Article Views (full-text article views including HTML views, PDF and ePub downloads, according to the available data) and Abstracts Views on Vision4Press platform.
Data correspond to usage on the plateform after 2015. The current usage metrics is available 48-96 hours after online publication and is updated daily on week days.
Initial download of the metrics may take a while.