Fig. 8
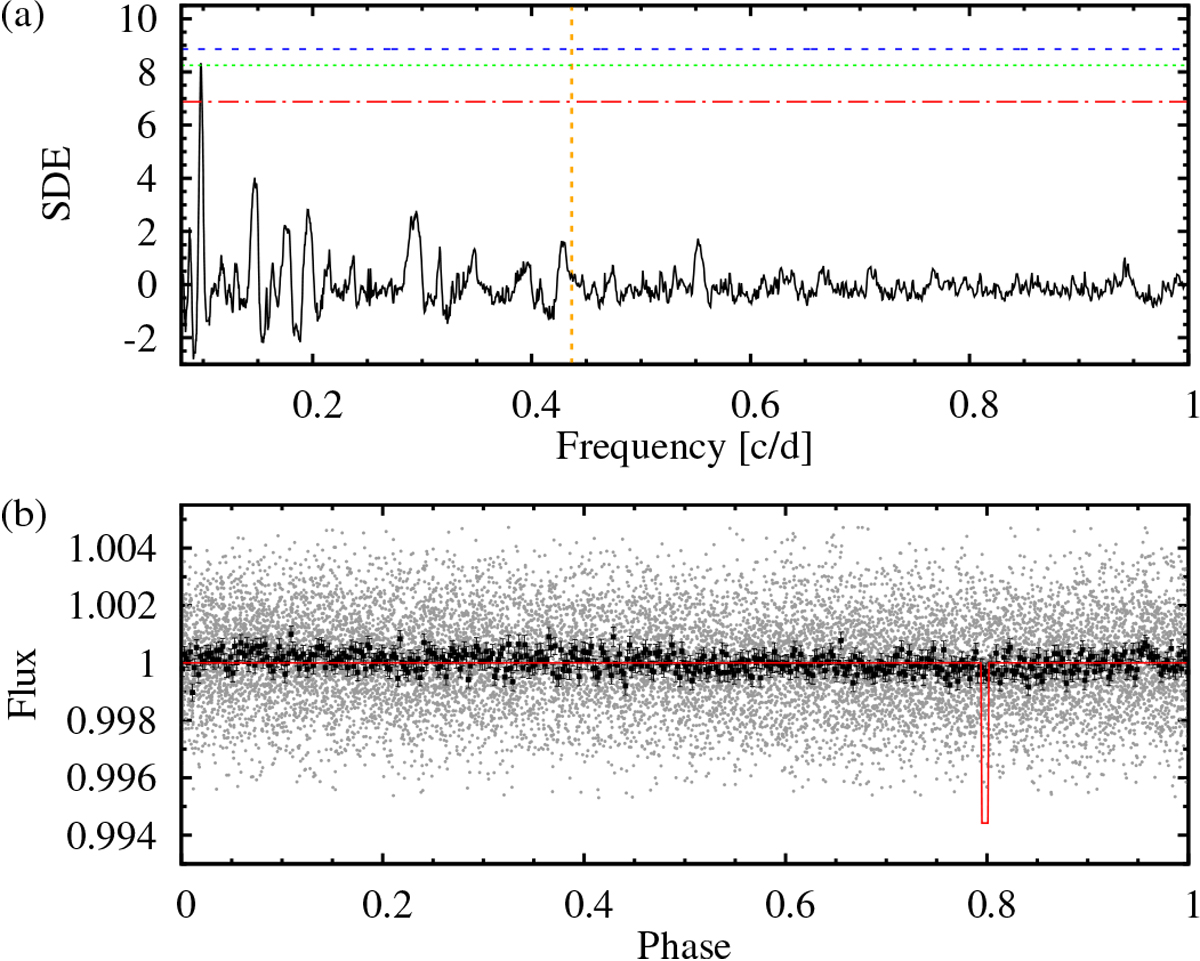
Transit search in the TESS lightcurve. Top: signal detection efficiency (SDE) as a function of frequency using the Transit Least Squares algorithm. Horizontal lines indicates false alarm probabilities of 10 (red), 1 (green), and 0.1% (blue). Vertical orange dotted line marks the planetary period Pb = 2.2907 d present in the RVs. Bottom: TESS data (gray: two minute cadence, black: binned to 500 phase points) folded to Pb = 2.2907 d guided by the RV solution along with the expected transit signal (red solid line).
Current usage metrics show cumulative count of Article Views (full-text article views including HTML views, PDF and ePub downloads, according to the available data) and Abstracts Views on Vision4Press platform.
Data correspond to usage on the plateform after 2015. The current usage metrics is available 48-96 hours after online publication and is updated daily on week days.
Initial download of the metrics may take a while.