Fig. 7
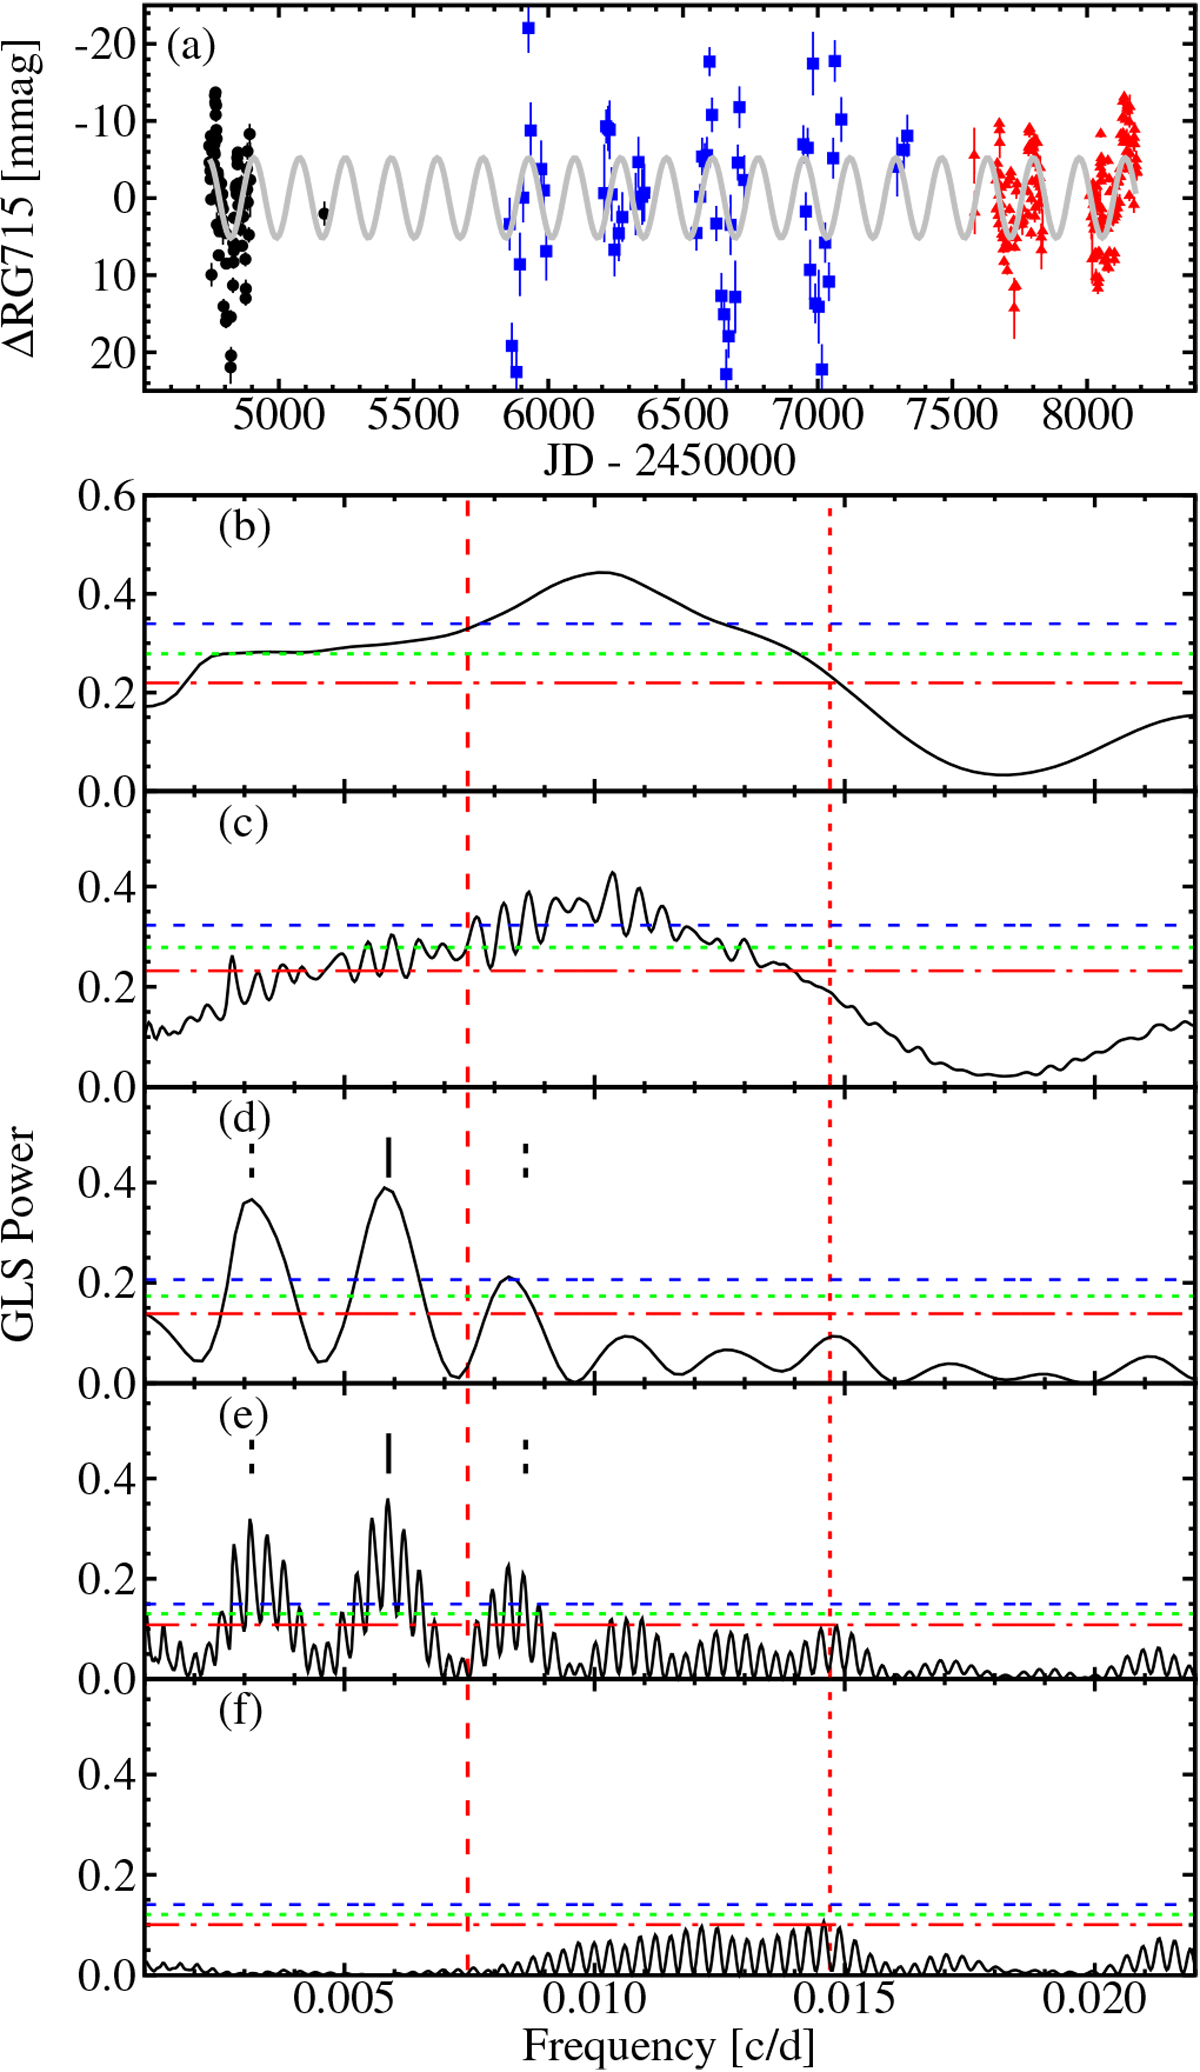
MEarth photometry of CD Cet. Panel a: light curve used by Díez Alonso et al. (2019, black circles), Newton et al. (2016, adding blue squares), and this work (adding red triangles). Bottom panels: (b) GLS periodograms of data used by Díez Alonso et al. (2019), (c) data used byNewton et al. (2016), (d) 2017/18 season data, (e) all public RG715 MEarth data, and (f) of their residuals after subtracting the 170 d period. Ticks in panels d and e mark a 170 d period (solid black) and its one-year aliases (dashed black). The vertical red dashed line marks the 134 d period found in RV data and some spectral activity indicators, and the vertical red dotted line marks the 68 d period found in VIS channel RV data.
Current usage metrics show cumulative count of Article Views (full-text article views including HTML views, PDF and ePub downloads, according to the available data) and Abstracts Views on Vision4Press platform.
Data correspond to usage on the plateform after 2015. The current usage metrics is available 48-96 hours after online publication and is updated daily on week days.
Initial download of the metrics may take a while.