Fig. 5
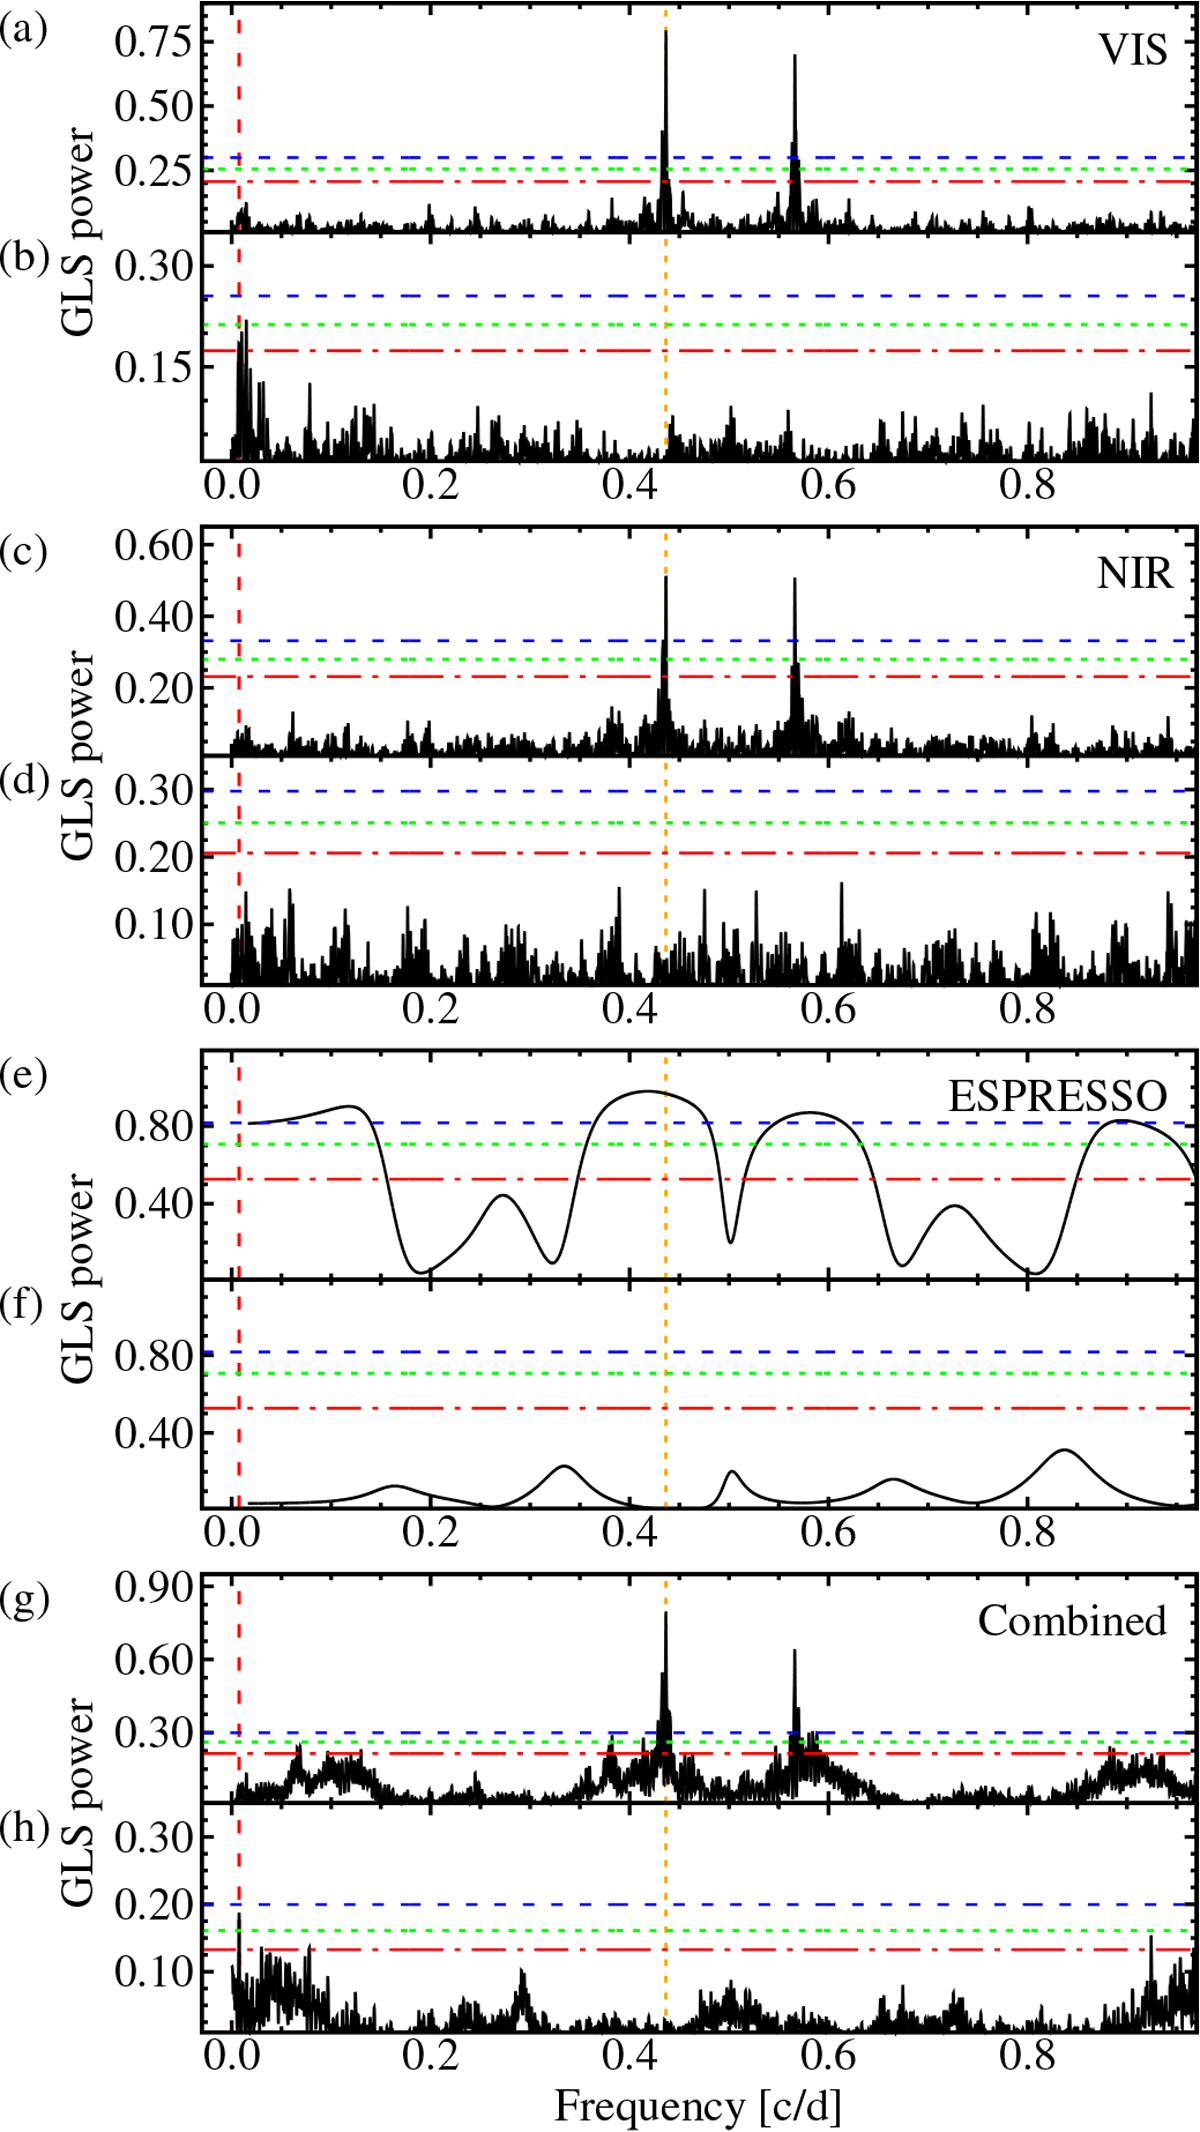
GLS periodograms of the data from the VIS channel (a) and (b), the NIR channel (c) and (d), and ESPRESSO (e) and (f). Bottom panels always show the residual periodograms after subtracting the 2.3 d signal. The 2.3 d and the 134 d signal are indicated by the vertical orange dotted and vertical red dashed line, respectively. FAPs are indicated by horizontal lines: 10 (dash-dotted red), 1 (dotted green), 0.1% (dashed blue).
Current usage metrics show cumulative count of Article Views (full-text article views including HTML views, PDF and ePub downloads, according to the available data) and Abstracts Views on Vision4Press platform.
Data correspond to usage on the plateform after 2015. The current usage metrics is available 48-96 hours after online publication and is updated daily on week days.
Initial download of the metrics may take a while.