Fig. 3
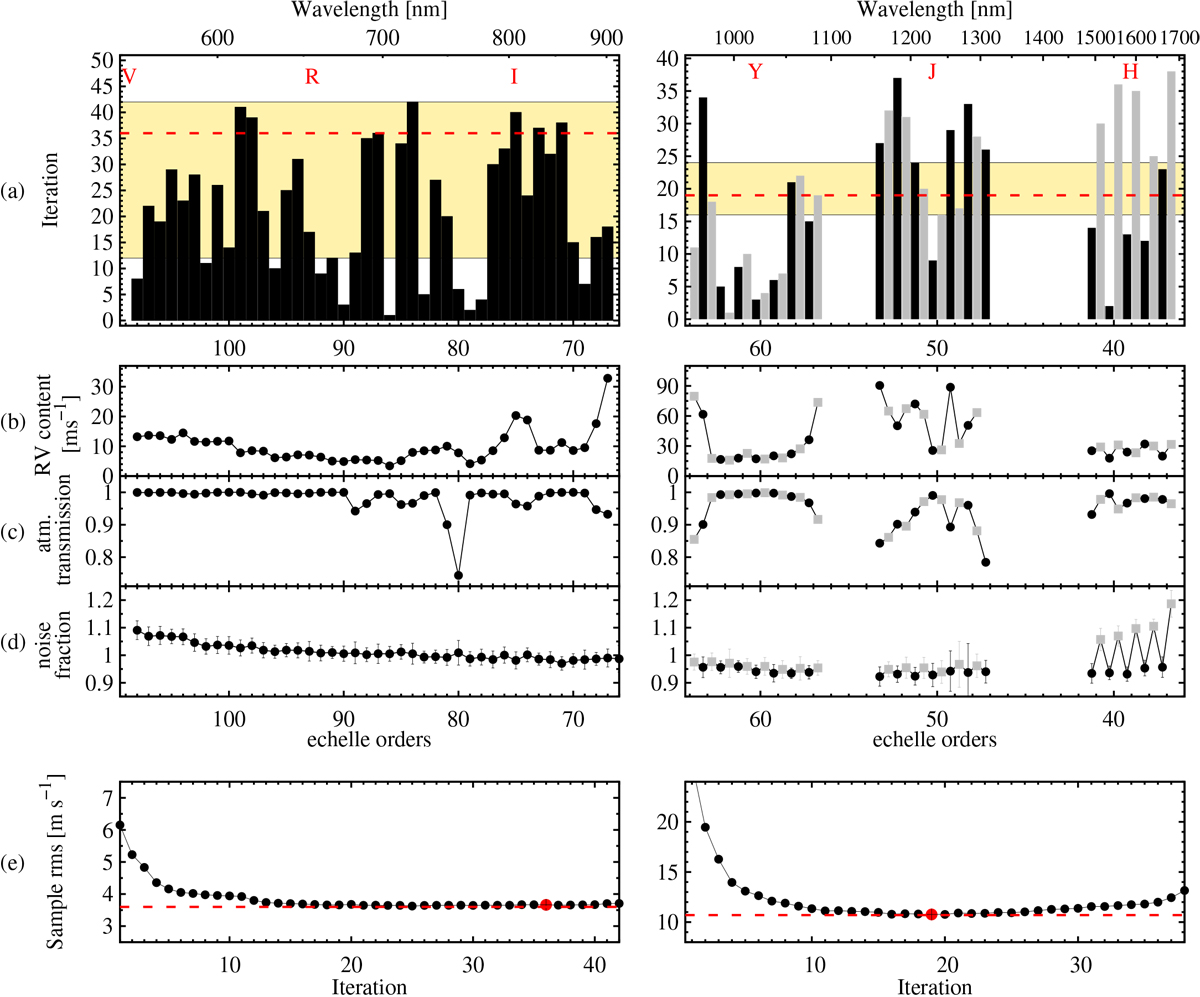
Panela: order selection procedure to minimize the sample rms of the VIS (left) and NIR (right) channels. Each bar represents the number of iterations that the algorithm takes until this order is used in the RV determination. Half orders that fall on the blue detector of the NIR channel are marked in black, while red half orders are colored gray. The iteration limit at which the minimum sample rms is reached is indicated by the red dashed horizontal line. The light orange shaded area marks orders which, when added or rejected, keep the sample rms within 0.2 m s−1. Panel b: RV content per spectral (half) order. Panel c: average atmospheric transmission per spectral (half) order. Panel d: ratio between measured noise in the spectra and pixel uncertainty (photon plus read out). Panel e: median sample rms as a function of the number of selected orders for the VIS (left) and NIR (right) channels. The median sample rms attains its minimum, indicated by the red dashed horizontal line, at the iteration marked by the big red dot (VIS: 35 iterations at rms 3.6 m s−1, NIR: 19 iterations at rms 10.7 m s−1).
Current usage metrics show cumulative count of Article Views (full-text article views including HTML views, PDF and ePub downloads, according to the available data) and Abstracts Views on Vision4Press platform.
Data correspond to usage on the plateform after 2015. The current usage metrics is available 48-96 hours after online publication and is updated daily on week days.
Initial download of the metrics may take a while.