Free Access
Fig. A.1
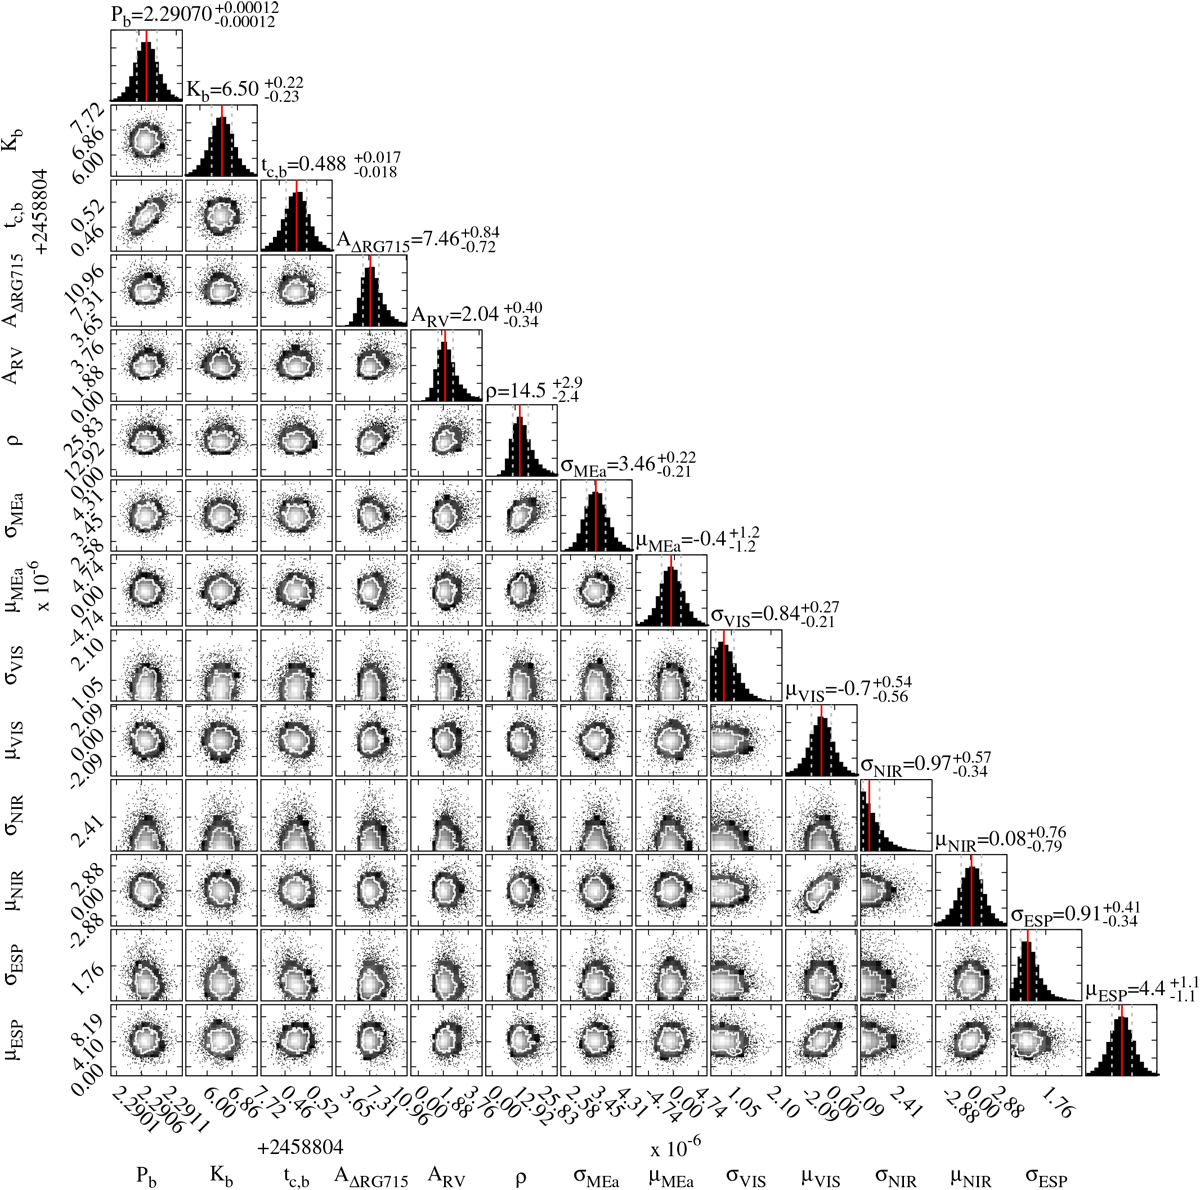
Sample distribution for the combined fit of RVs and MEarth photometry (Table 5). The vertical line in each histogram indicates the median (50% quantile, solid red) and the 1σ uncertainties (16 and 84% quantiles, dashed gray).
Current usage metrics show cumulative count of Article Views (full-text article views including HTML views, PDF and ePub downloads, according to the available data) and Abstracts Views on Vision4Press platform.
Data correspond to usage on the plateform after 2015. The current usage metrics is available 48-96 hours after online publication and is updated daily on week days.
Initial download of the metrics may take a while.