Fig. 9.
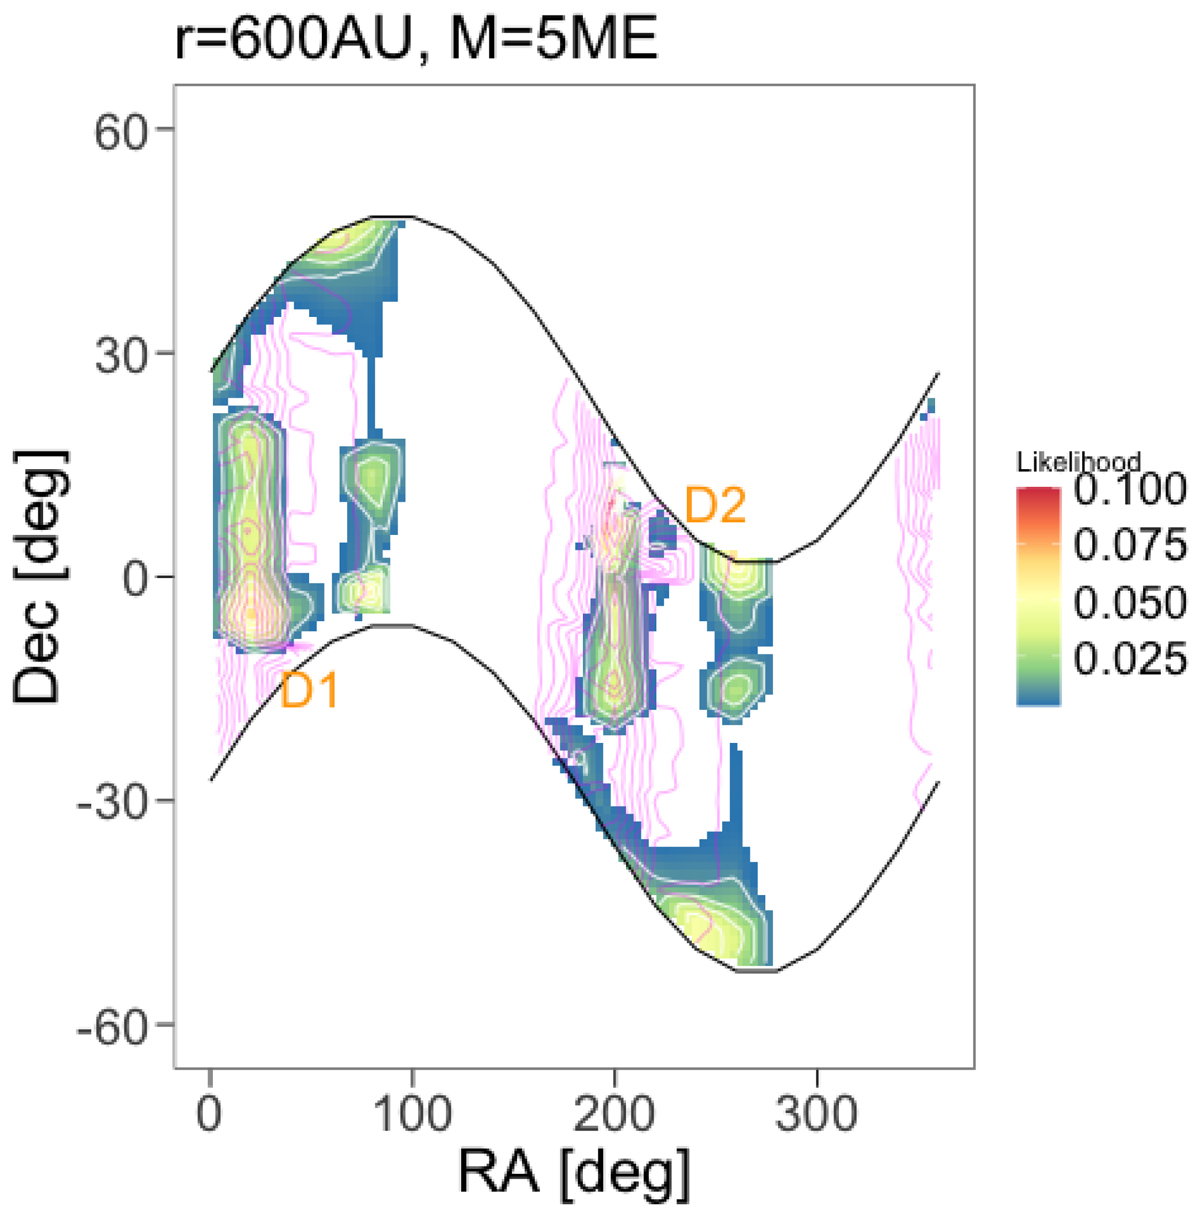
Likelihood obtained for r = 600 AU and MP9 = 5 M⊕. The white portion of the map corresponds to solutions that have a probability greater than 0.997 (3σ) to be rejected. The label D indicates the most acceptable zones (with higher likelihoods) in the ecliptic plane. For comparison, the dotted magenta lines indicate the zones for which T1 is greater than 75% according to the propagated covariance (see Fig. 4).
Current usage metrics show cumulative count of Article Views (full-text article views including HTML views, PDF and ePub downloads, according to the available data) and Abstracts Views on Vision4Press platform.
Data correspond to usage on the plateform after 2015. The current usage metrics is available 48-96 hours after online publication and is updated daily on week days.
Initial download of the metrics may take a while.