Fig. 5.
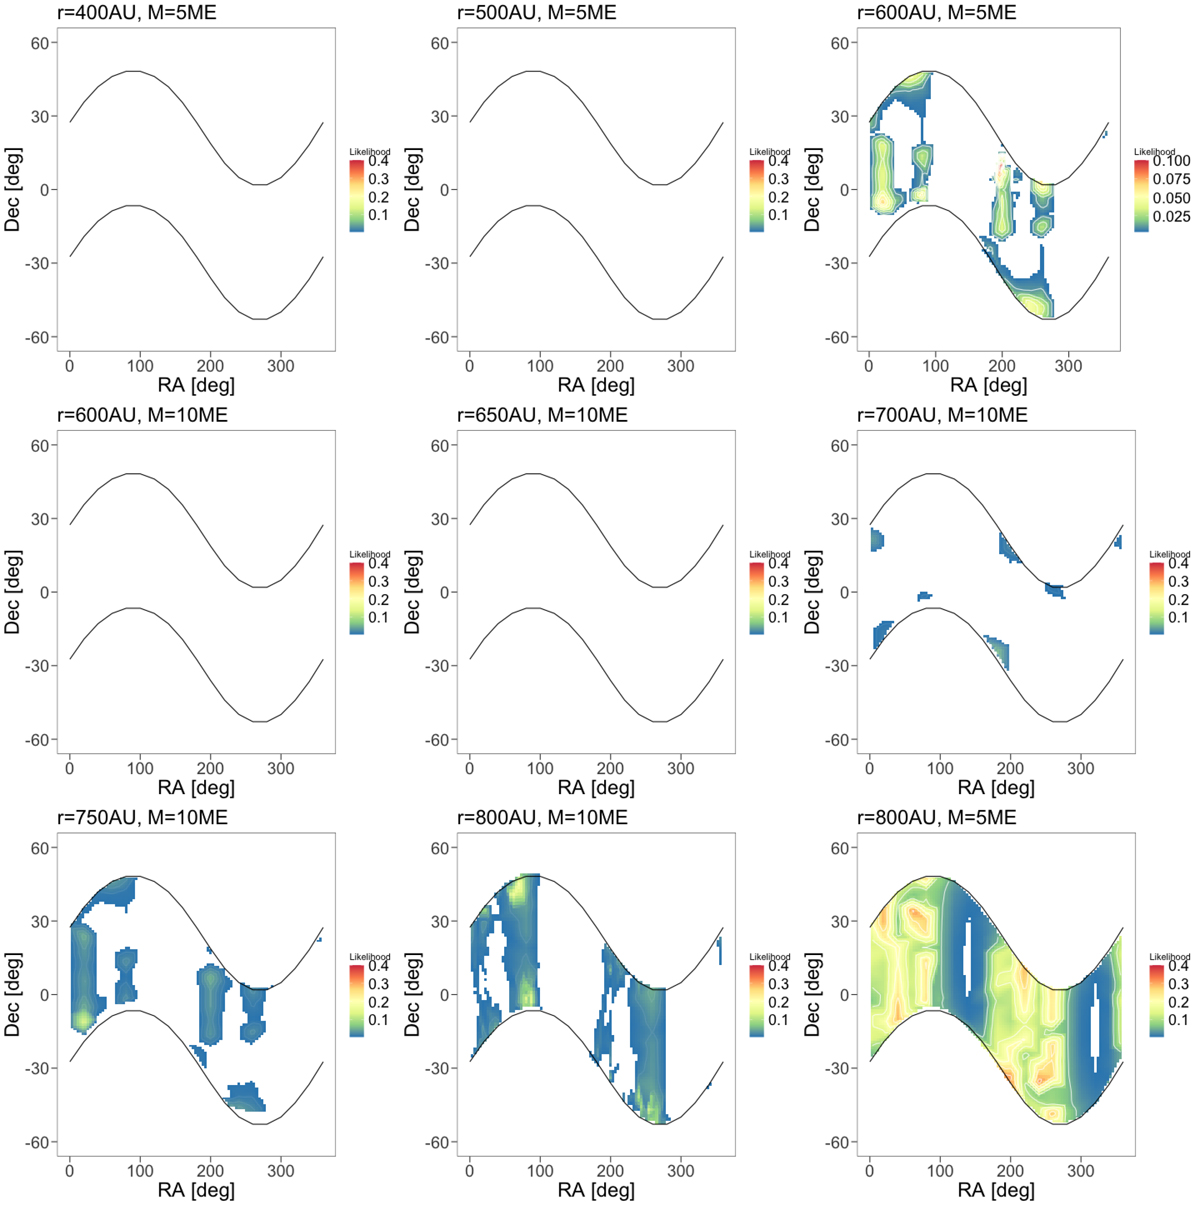
Likelihood considering r = 400, 500, 600, 650, 700, 750, and 800 AU and MP9 = 5, 10 M⊕. The x-axis represents the RA of P9 when the y-axis is its Dec. The z-axis gives the likelihood (see Sect. 3.3 for a definition) of the ephemerides that include perturbations by P9 with respect to INPOP19a. The white portions of the maps correspond to solutions rejected at 3σ (L < 0.003).
Current usage metrics show cumulative count of Article Views (full-text article views including HTML views, PDF and ePub downloads, according to the available data) and Abstracts Views on Vision4Press platform.
Data correspond to usage on the plateform after 2015. The current usage metrics is available 48-96 hours after online publication and is updated daily on week days.
Initial download of the metrics may take a while.