Fig. 4.
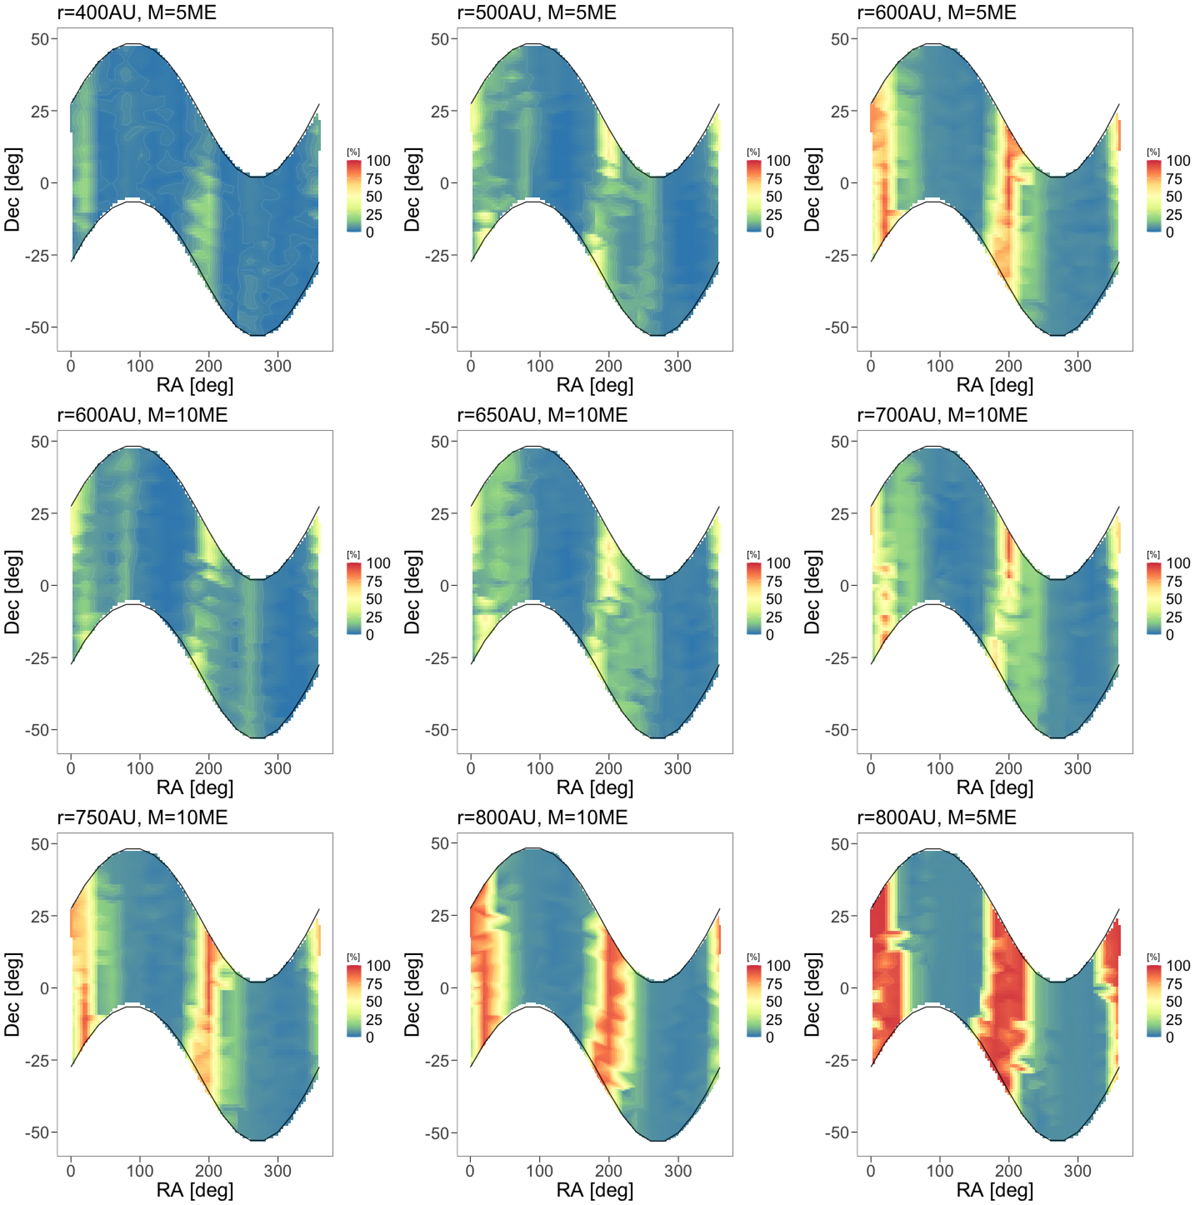
Percentage of matches based on the propagated covariance for Saturn, considering r = 400, 500, 600, 650, 700, 750, and 800 AU and MP9 = 5 and 10 M⊕. The x-axis represents the RA of P9 when the y-axis is its Dec. The z-axis gives the matches (see Sect. 4.1 for a defintion) in percent between the INPOP19a propagated covariance of the Saturn orbit over the time coverage of the data and the Saturn-orbit-propagated covariance of the ephemerides including perturbations by P9.
Current usage metrics show cumulative count of Article Views (full-text article views including HTML views, PDF and ePub downloads, according to the available data) and Abstracts Views on Vision4Press platform.
Data correspond to usage on the plateform after 2015. The current usage metrics is available 48-96 hours after online publication and is updated daily on week days.
Initial download of the metrics may take a while.