Fig. 2.
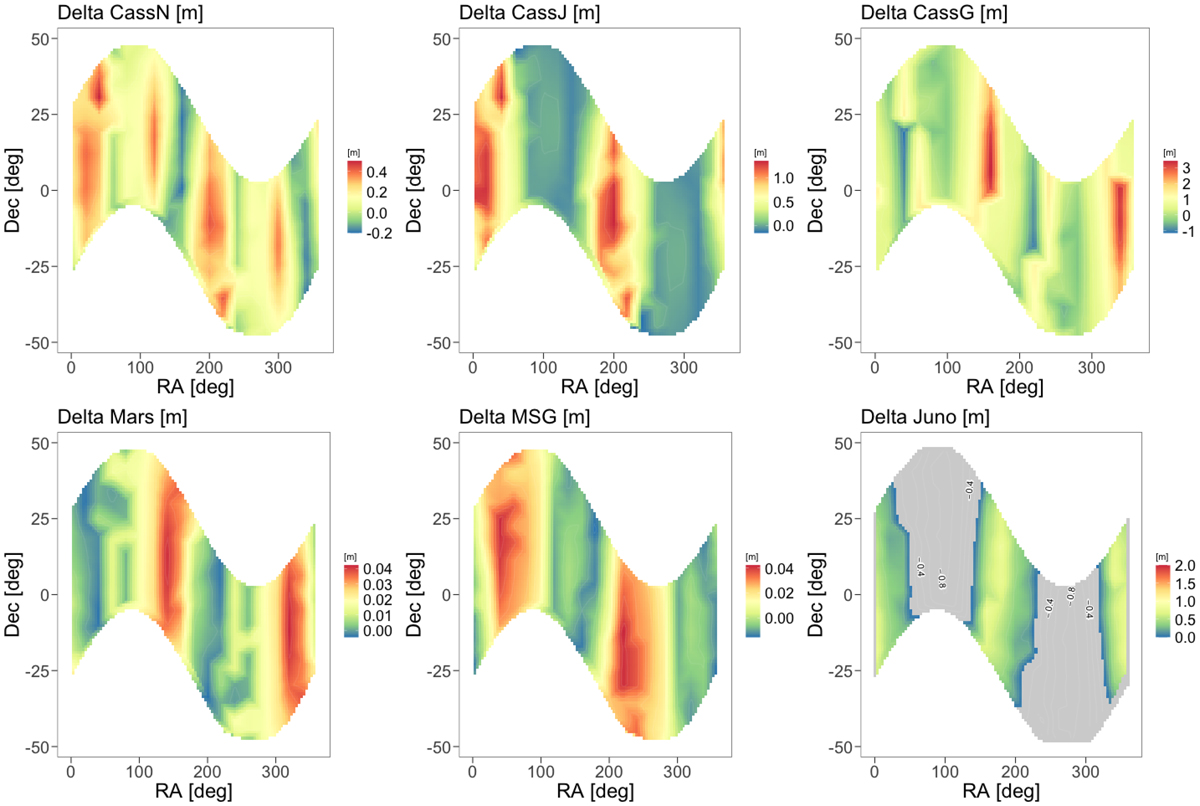
Differences between INPOP19a postfit residuals and postfit residuals of (RA, Dec) solutions obtained with r = 800 AU and MP9 = 10 M⊕. The x-axis represents the RA of P9 when the y-axis is the Dec of P9. The z-axis gives the differences in meters for different observational data sets between INPOP19a residuals and the ephemerides including the P9 perturbations. Several observational subsamples are considered: CassN corresponds to the data sample presented in Sect. 2.1.1 that is labeled Nav+TGF range in Table 1, CassJ is the data sample analyzed and distributed by the JPL (see Hees et al. 2014), and finally, CassG corresponds to the Saturn positions deduced from the Grand Finale as described in Sect. 2.1.1. Juno, Mars, and MSG indicate the variations in postfit residuals for the Jupiter observations by Juno, described in Sect. 2.1.2; Mars means the observations of Mars, and MSG those of Mercury provided by Verma & Margot (2016). The Juno residuals are improved relative to INPOP19a in the gray zones.
Current usage metrics show cumulative count of Article Views (full-text article views including HTML views, PDF and ePub downloads, according to the available data) and Abstracts Views on Vision4Press platform.
Data correspond to usage on the plateform after 2015. The current usage metrics is available 48-96 hours after online publication and is updated daily on week days.
Initial download of the metrics may take a while.