Fig. 2.
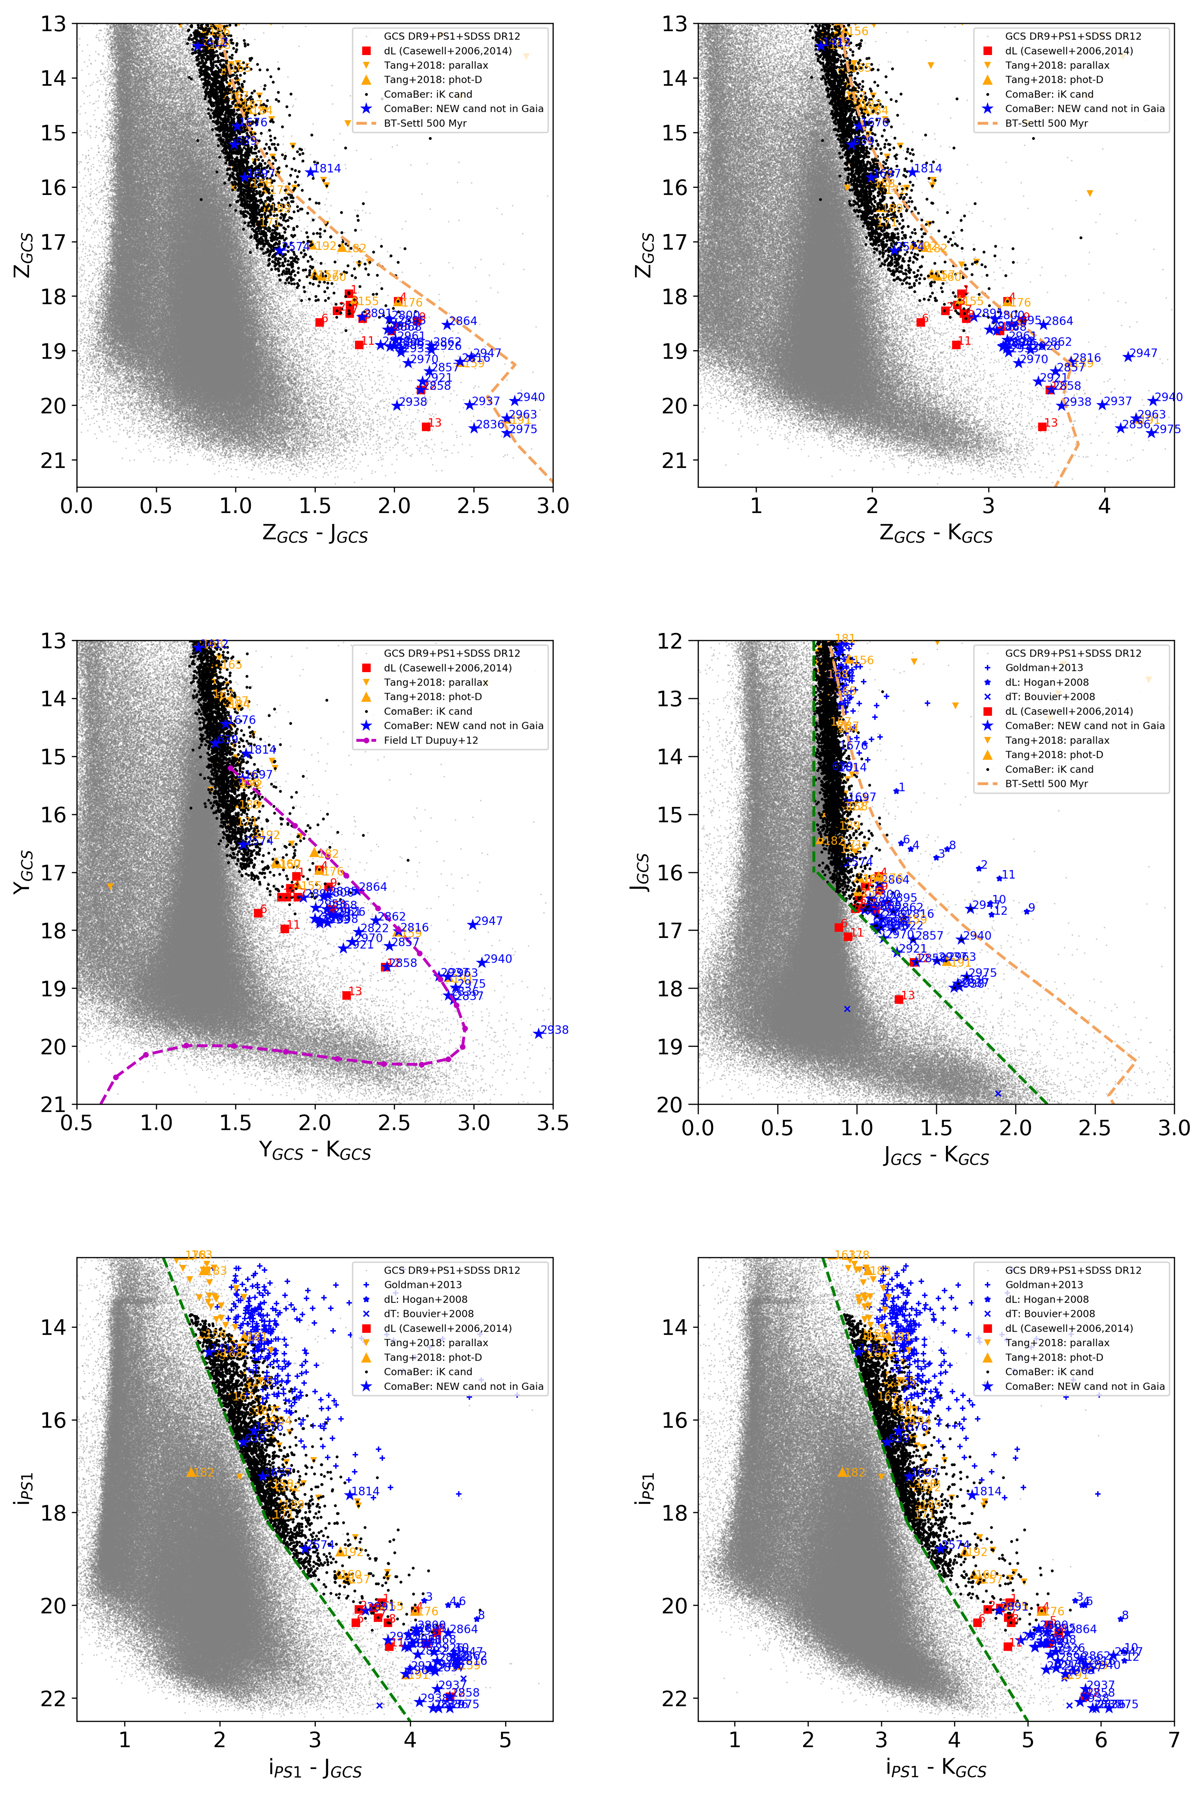
Colour–magnitude diagrams with optical and infrared photometry from the GCS and Pan-STARRS surveys showing all sources common to UKIDSS GCS, Pan-STARRS DR1, and SDSS DR12 (small grey dots) along with iK candidates selected photometrically along the line of sight of Coma Ber. Overplotted are candidates from Casewell et al. (2006, 2014), Tang et al. (2018), and our study as red squares, orange triangles, and blue asterisks, respectively. The 500 Myr BT-Settl isochrones (Baraffe et al. 2015) are added Or, “are shown”.as dashed orange lines and members in the Hyades (Hogan et al. 2008; Bouvier et al. 2008; Goldman et al. 2013); the sequence of field ultra-cool dwarfs with known distances (magenta dashed curve) is shown for comparison in the diagrams for which suitable photometric data are available. The selection cuts to identify photometric candidate members in Coma Ber are shown as green dashed lines.
Current usage metrics show cumulative count of Article Views (full-text article views including HTML views, PDF and ePub downloads, according to the available data) and Abstracts Views on Vision4Press platform.
Data correspond to usage on the plateform after 2015. The current usage metrics is available 48-96 hours after online publication and is updated daily on week days.
Initial download of the metrics may take a while.