Fig. 6.
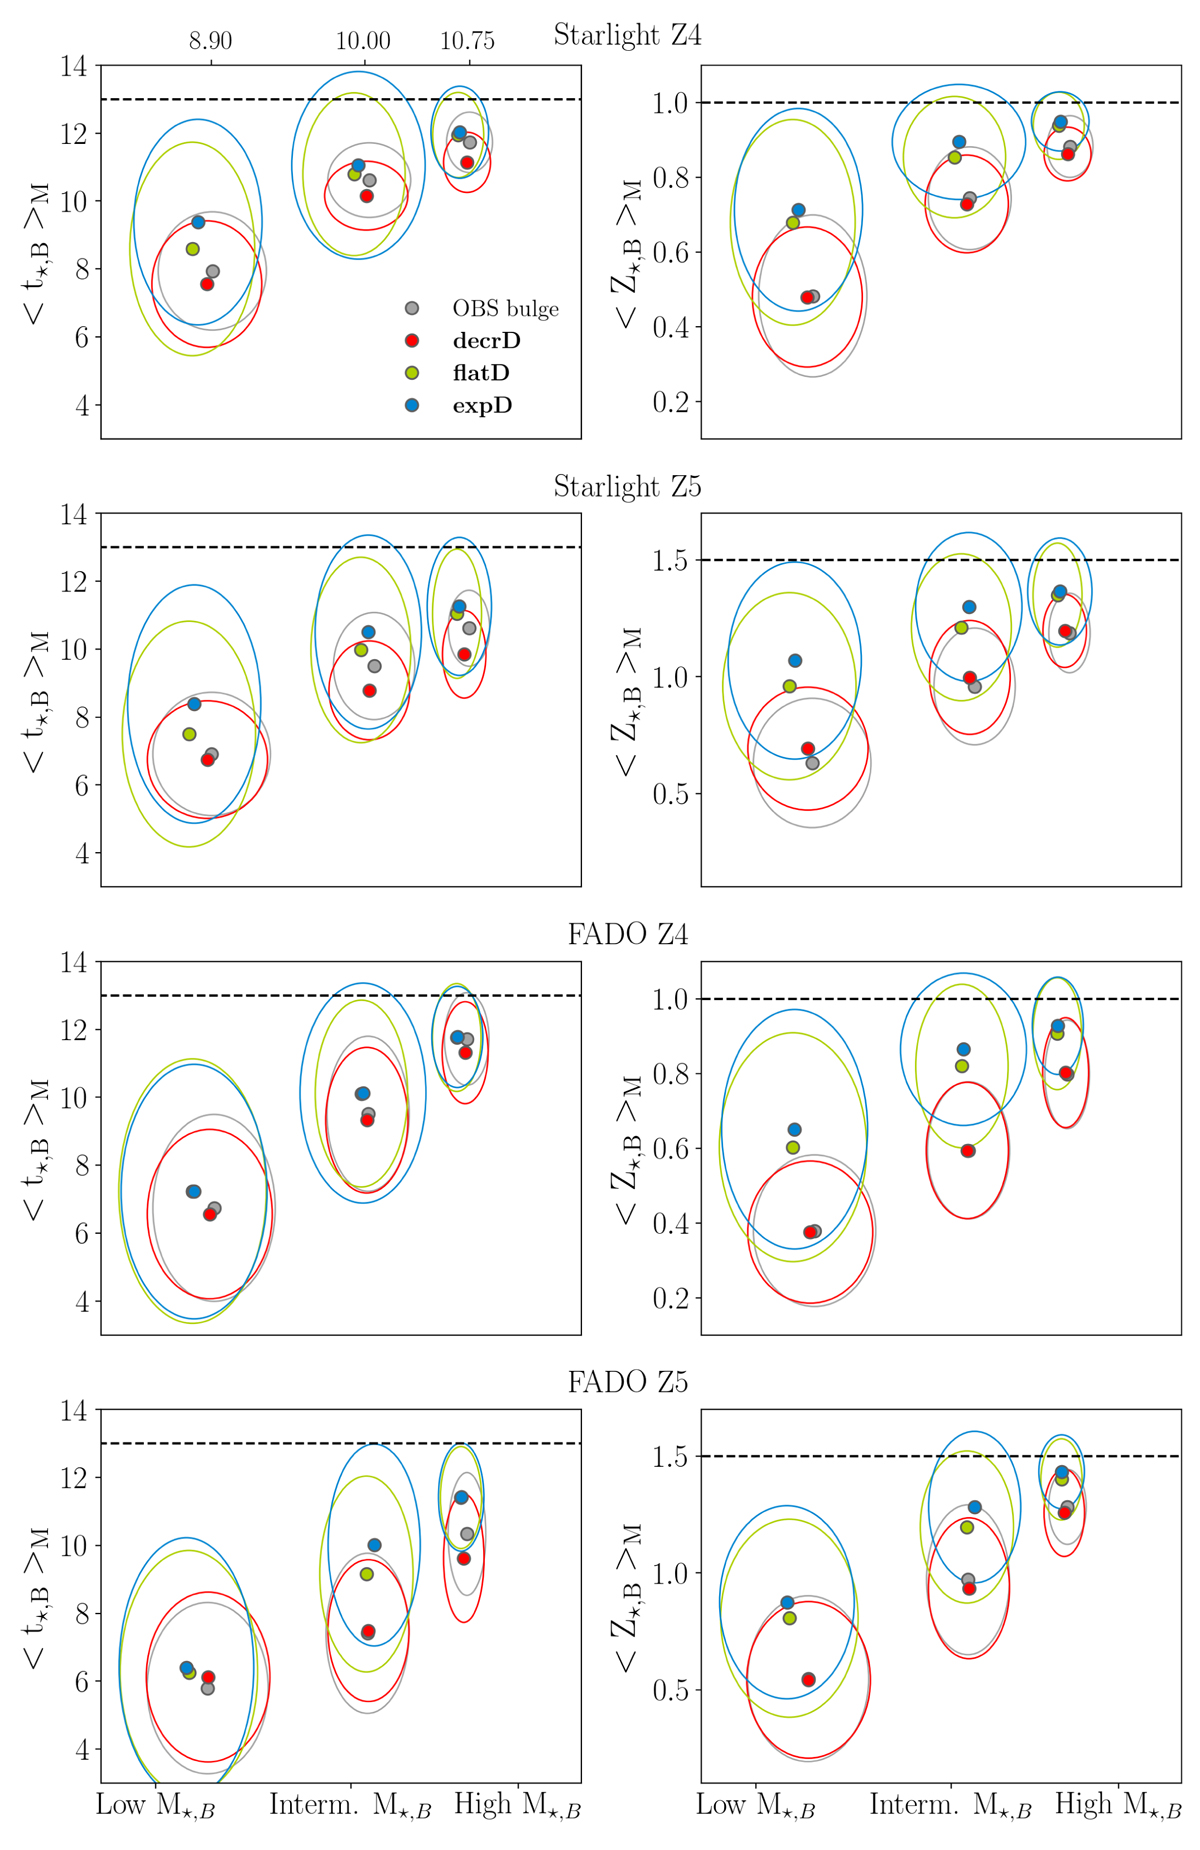
Panels in the l.h.s. display the mean values for the bulge’s mass-weighted stellar age ⟨t⋆, B⟩ℳ in Gyr, in each mass bin, in the case of no subtraction (gray), subtraction of a centrally depressed disk (red), subtraction of centrally flattened disk (green) and subtraction of exponential disk (blue). Panels at the r.h.s. display the mean estimated values for the bulge’s mass-weighted stellar metallicity ⟨Z⋆, B⟩ℳ in Z⊙. The ellipses represent the standard deviation σ of the mean, providing an estimate on how spread are these estimates within each bin mass. Their semi-major and minor axes display the σ in M⋆, B (in the x-axis) and the σ in ⟨t⋆, B⟩ℳ or ⟨Z⋆, B⟩ℳ (in the y-axis). The 1st panel contains an additional x-axis providing information on the average stellar mass for each bulge bin mass. From top to bottom: rows refer to the four spectral modeling runs. The horizontal dashed line indicates the maximum allowed value for the respective quantity and SSP library.
Current usage metrics show cumulative count of Article Views (full-text article views including HTML views, PDF and ePub downloads, according to the available data) and Abstracts Views on Vision4Press platform.
Data correspond to usage on the plateform after 2015. The current usage metrics is available 48-96 hours after online publication and is updated daily on week days.
Initial download of the metrics may take a while.