Fig. 4.
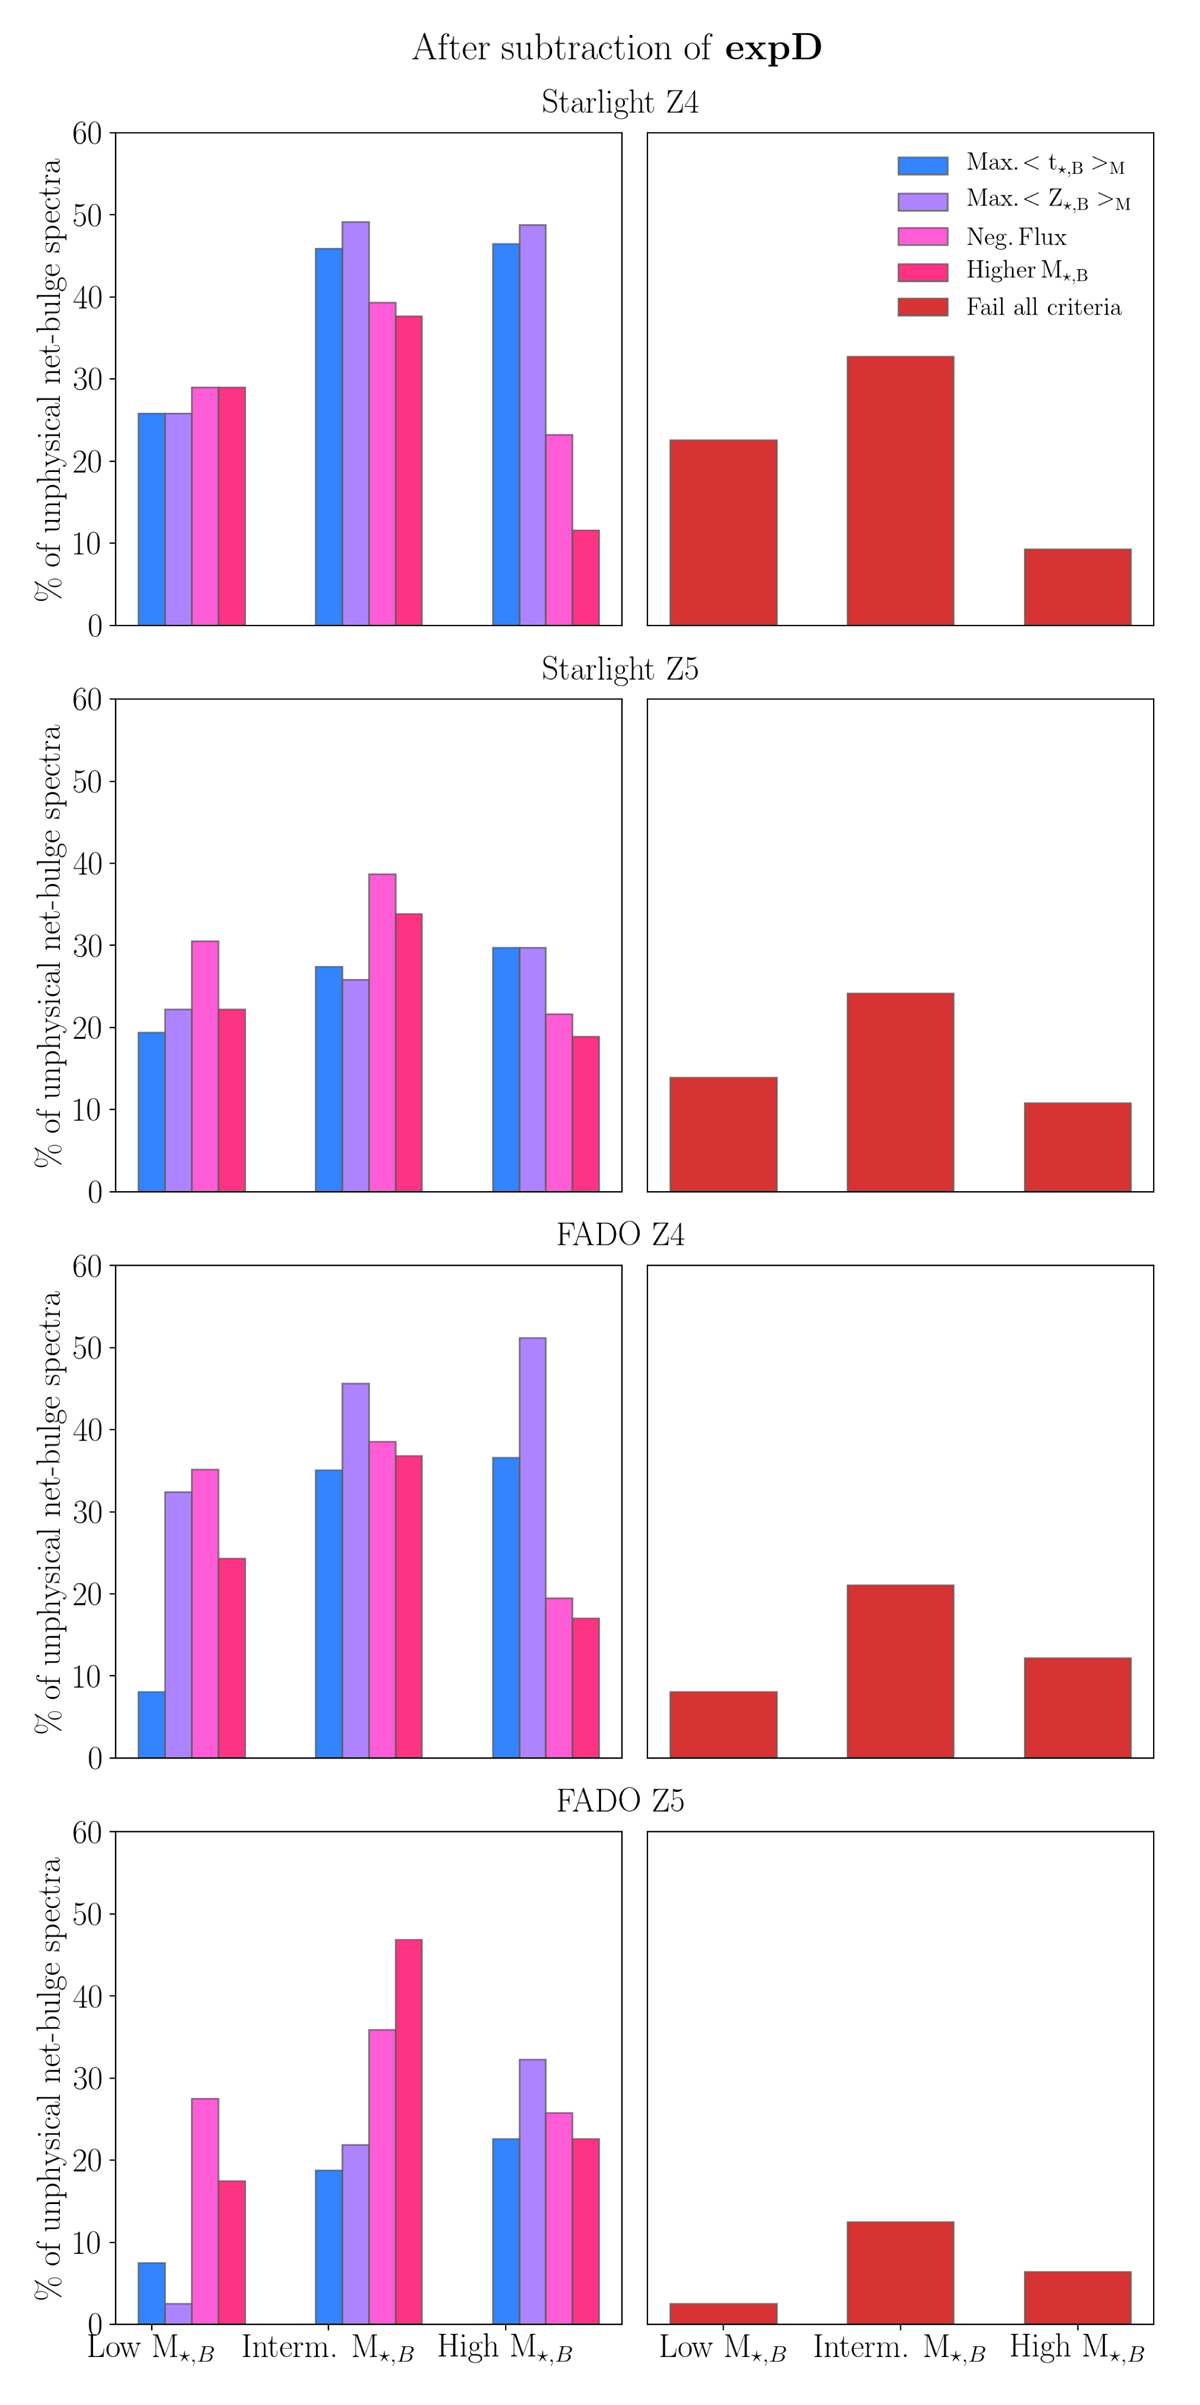
Panels in the l.h.s. display the histograms showing the fractions of unphysical net-bulge spectra after subtraction of expD, subdivided in three bulge mass bins (low M⋆, B for bulges with log of stellar mass lower or equal than 9.5 M⊙, intermediate M⋆, B for bulges with log of stellar mass between 9.5 and 10.5 and high M⋆, B for bulges with log of stellar mass higher or equal than 10.5). From left to right: bars represent the fraction of net-bulge spectra that reached the maximum mass-weighted stellar age (blue) and metallicity (purple), display negative flux (light pink) and which estimated stellar mass is higher after disk subtraction (dark pink). Panels in the r.h.s. contain the histograms showing the fractions of unphysical net-bulge spectra that meet all the aforementioned criteria. From top to bottom: rows refer to the spectral modeling run SLZ4, SLZ5, FDZ4 and FDZ5.
Current usage metrics show cumulative count of Article Views (full-text article views including HTML views, PDF and ePub downloads, according to the available data) and Abstracts Views on Vision4Press platform.
Data correspond to usage on the plateform after 2015. The current usage metrics is available 48-96 hours after online publication and is updated daily on week days.
Initial download of the metrics may take a while.