Fig. 3.
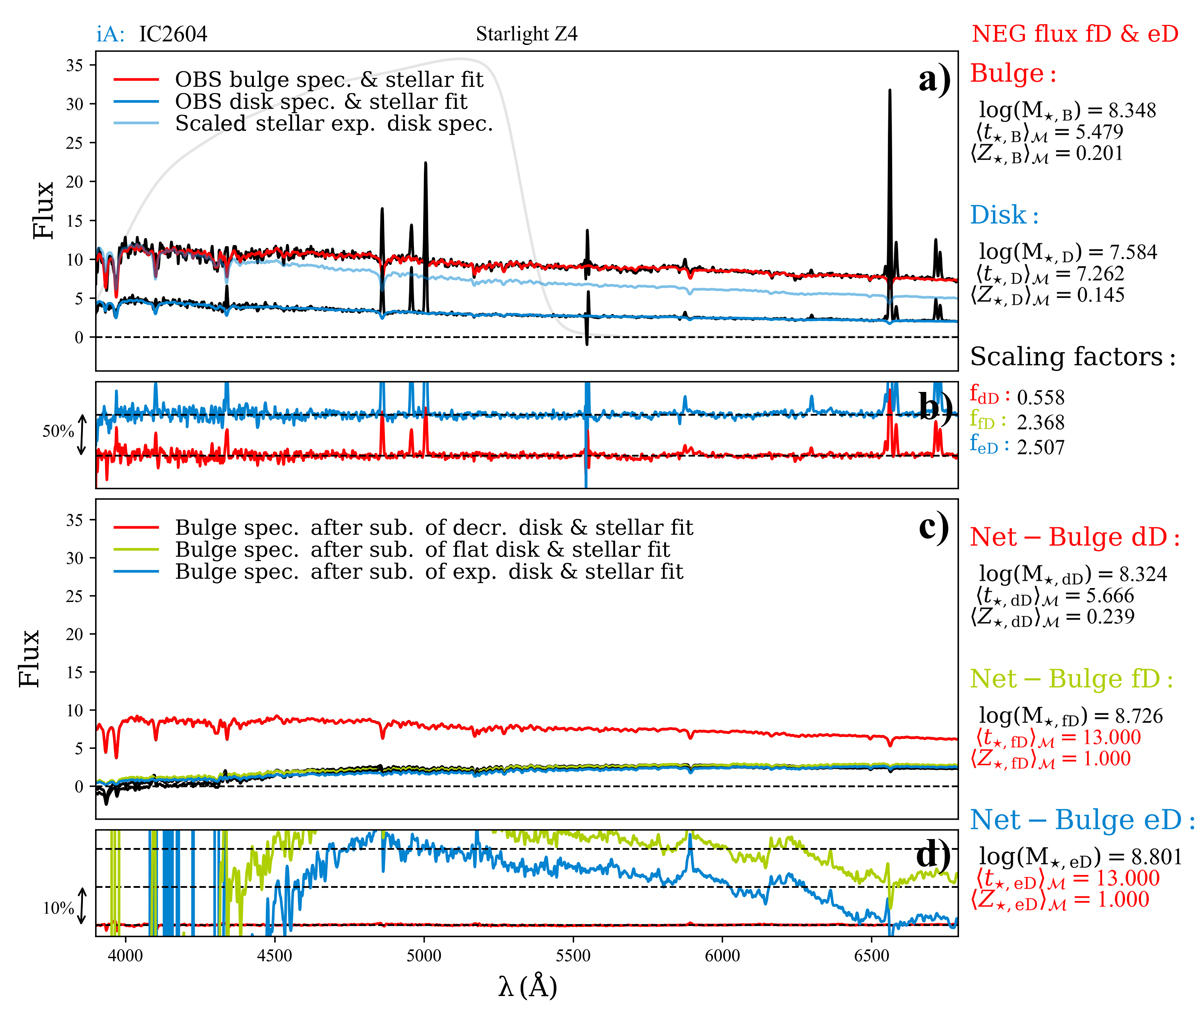
Resulting spectra and respective fits for LTG IC 2604 – panel a displays the spectrum of the bulge (red), disk (dark-blue) and scaled disk (light-blue) according to the exponential disk distribution (additionally it can be seen the overplotted SDSS g-band transmission curve in soft gray). Panel b: displays the residuals (in %) between the modeled and observed spectrum for the bulge (red) and disk (dark-blue) with the black horizontal line corresponding in either case to a percentage deviation of 0%. The vertical arrow corresponds to a percentage deviation of 50%. At panel c it is shown in black the resulting net-bulge spectra after subtraction of the three different models for the disk and overplotted are the respective stellar fits. The residuals, that is the difference between obtained net-bulge SED and respective stellar fits divided by the observed, are shown in panel d. As in panel b we shift the residuals by an arbitrary amount (in this case, by 10%; cf. vertical arrow) for the sake of better visibility. Labels on the r.h.s. of the panels list the bulge and disk stellar mass log(ℳ⋆), and mass-weighted mean stellar age ⟨t⋆, B⟩ℳ and metallicity ⟨Z⋆, B⟩ℳ prior to subtraction, the scaling factors for each of the disk configuration and ⟨t⋆, B⟩ℳ and ⟨Z⋆, B⟩ℳ for each of the fits (where dD, fD and eD corresponds to centrally decreasing, flat and exponential disk, respectively), as obtained with STARLIGHT and Z4 stellar library.
Current usage metrics show cumulative count of Article Views (full-text article views including HTML views, PDF and ePub downloads, according to the available data) and Abstracts Views on Vision4Press platform.
Data correspond to usage on the plateform after 2015. The current usage metrics is available 48-96 hours after online publication and is updated daily on week days.
Initial download of the metrics may take a while.