Fig. 2.
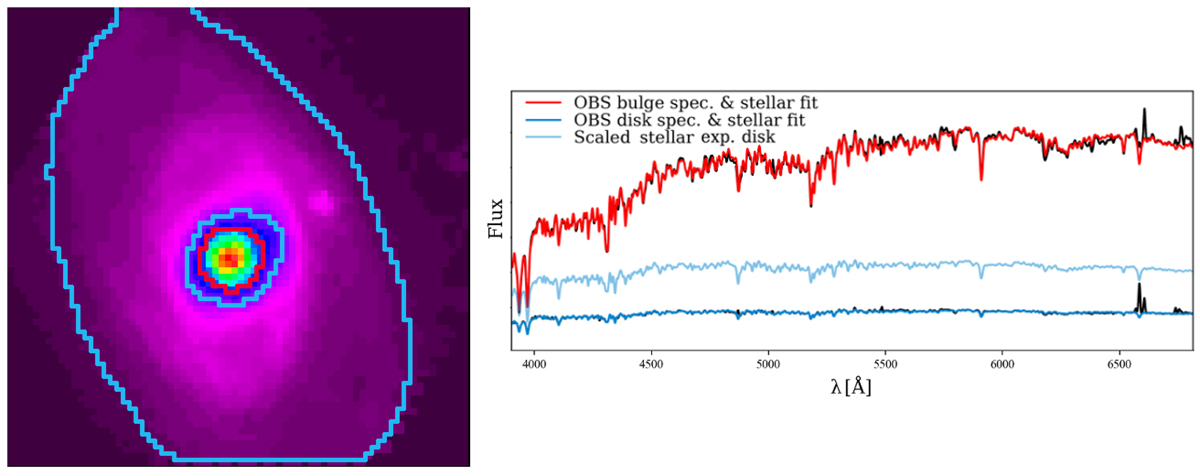
Illustration of the CALIFA IFS data (spaxel-by-spaxel map) of NGC 0036 (l.h.s.) where it is shown the emission-line-free pseudo-continuum between 6390 and 6490 Å. Within the red contour are the spaxels that were integrated to obtain a single bulge spectrum which is shown in the r.h.s. along with its respective best-fitting stellar SED as obtained by STARLIGHT, Z4, in red. As for the average disk spectrum displayed in the r.h.s. overplotted by its best-fitting stellar spectrum, in dark-blue, was obtained by integrating the spaxels that lay between the two blue contours in the l.h.s. and subsequent division by the considered number of spaxels. Additionally, it is plotted in light-blue at the r.h.s. the best-fitting stellar SED for the disk after scaling according to the exponential model.
Current usage metrics show cumulative count of Article Views (full-text article views including HTML views, PDF and ePub downloads, according to the available data) and Abstracts Views on Vision4Press platform.
Data correspond to usage on the plateform after 2015. The current usage metrics is available 48-96 hours after online publication and is updated daily on week days.
Initial download of the metrics may take a while.