Fig. 1.
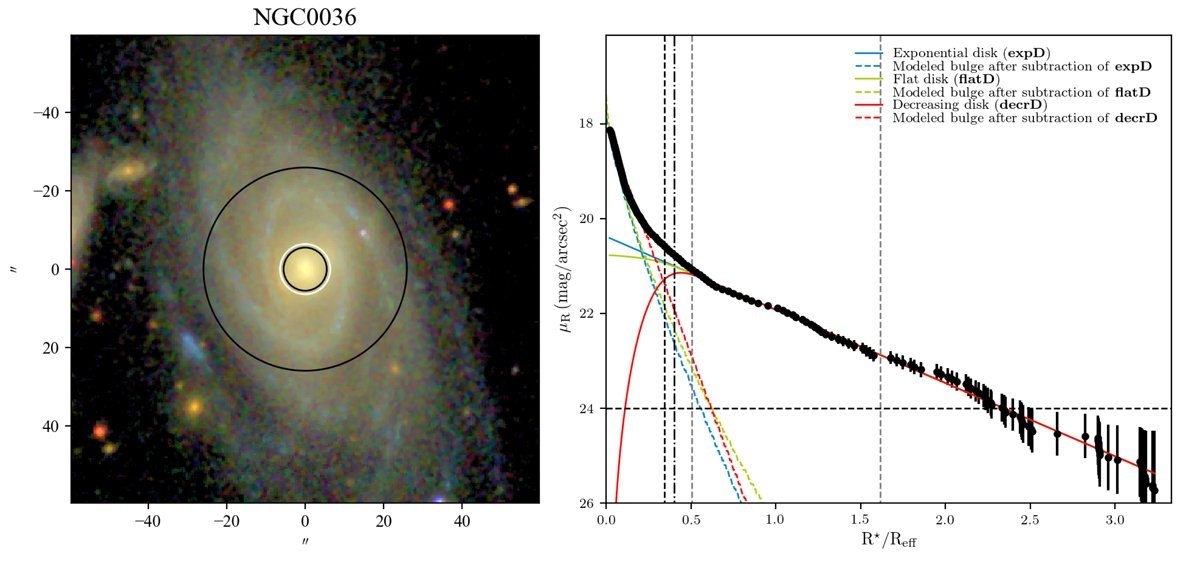
Left: SDSS true-color image of LTG NGC 0036. The white circle overlaid in the SDSS image depicts the bulge diameter (with radius RB) and the innermost black circle illustrates the bulge radius that was considered for this study (with radius RC, defined in Sect. 3.2). The radius of the outermost black circle corresponds to the limit of the disk (with radius RD). Right: SDSS g-band SBP illustrating the assumed three disk configurations (black points – observed profile; blue solid line – standard exponential disk, expD; green solid line – inwardly flattening disk, flatD; red solid line – centrally depressed disk, decrD). The colored dashed lines represent the modeled bulge after subtraction of the respective disk’s profile. The horizontal line denotes the limiting surface brightness at μ = 24 mag/▫″. Gray vertical lines denote the considered limits for the disk (the outermost gray line is illustrated by the uttermost circle in the l.h.s.), dashed vertical black line depicts RB (innermost black circle at the l.h.s.) and the dashed-dot vertical black line the RC (white circle at the l.h.s.). The galactocentric distance (x axis) is normalized to Reff.
Current usage metrics show cumulative count of Article Views (full-text article views including HTML views, PDF and ePub downloads, according to the available data) and Abstracts Views on Vision4Press platform.
Data correspond to usage on the plateform after 2015. The current usage metrics is available 48-96 hours after online publication and is updated daily on week days.
Initial download of the metrics may take a while.