Fig. 13
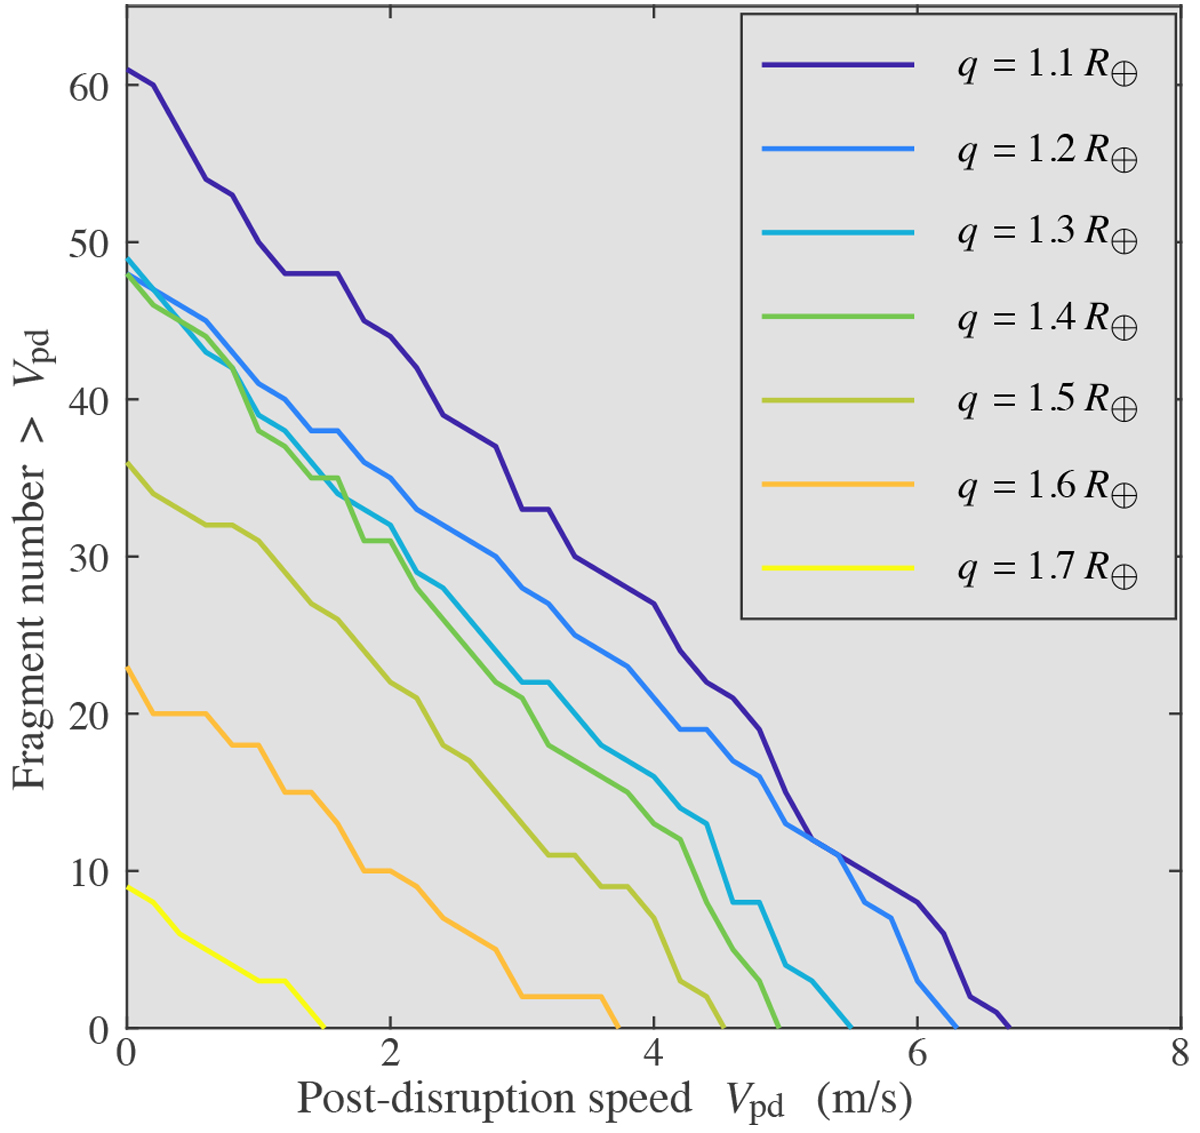
Cumulative fragment post-disruption speed distributions for the low-resolution HCP model in “disruption” events with V∞ = 1 km s−1 and differentq at the end of the SSDEM simulations (well beyond Earth’s Roche limit). The colors of the curves represent the results with different q as indicated in the legend. The post-disruption speed is calculated for each fragment with respect to the largest remnant in each case.
Current usage metrics show cumulative count of Article Views (full-text article views including HTML views, PDF and ePub downloads, according to the available data) and Abstracts Views on Vision4Press platform.
Data correspond to usage on the plateform after 2015. The current usage metrics is available 48-96 hours after online publication and is updated daily on week days.
Initial download of the metrics may take a while.