Fig. 9.
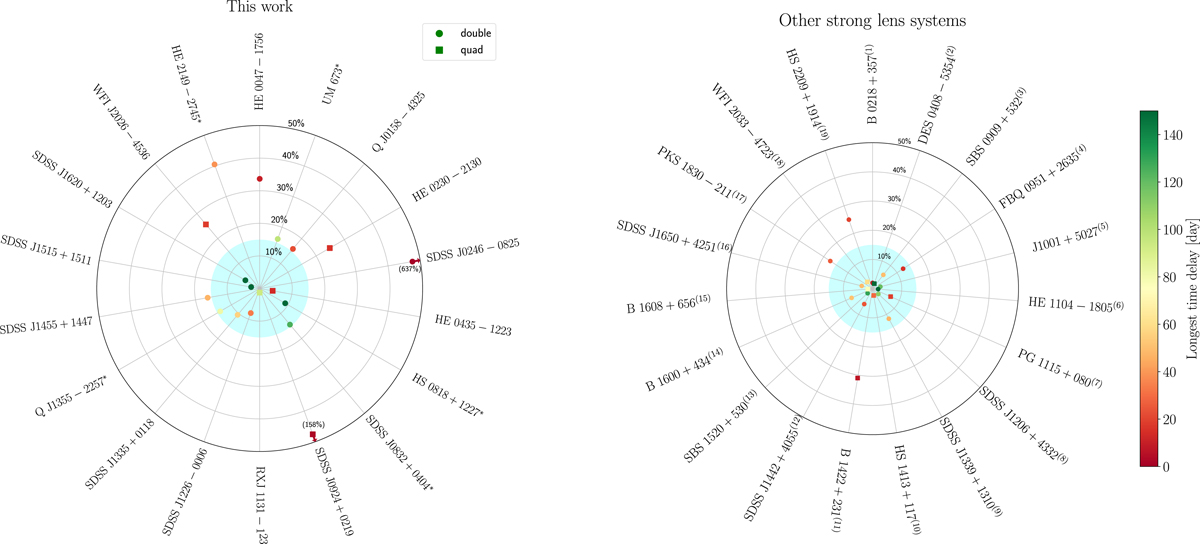
Relative uncertainties on the measured time delays for objects presented in this work (left) and for other time delays available in the literature (right). In the case of quadruply imaged systems and when several independent time delays are measured, we multiply the independent time-delay estimates to obtain the relative uncertainty that is achievable on H0. The light blue region corresponds to a precision of less than 15%. Systems marked with a * have uncertain or multi-modal time delays. The time delays from the literature can be found in (1) Biggs & Browne (2018), (2) Courbin et al. (2018), (3) Hainline et al. (2013), (4) Jakobsson et al. (2005), (5) Rathna Kumar et al. (2013), (6) Poindexter et al. (2007), (7) Bonvin et al. (2018), (8) Eulaers et al. (2013), (9) Goicoechea & Shalyapin (2016), (10) Akhunov et al. (2017), (11) Patnaik & Narasimha (2001), (12) Shalyapin & Goicoechea (2019), (13) Burud et al. (2002a), (14) Burud et al. (2000), (15) Fassnacht et al. (2002), (16) Vuissoz et al. (2007), (17) Lovell et al. (1998), (18) Bonvin et al. (2019), (19) Eulaers et al. (2013). We note that these time delays from the literature were not measured in an homogeneous way, sometimes not taking into account the microlensing in the light curves. The uncertainties for some of these systems are therefore likely to be largely underestimated.
Current usage metrics show cumulative count of Article Views (full-text article views including HTML views, PDF and ePub downloads, according to the available data) and Abstracts Views on Vision4Press platform.
Data correspond to usage on the plateform after 2015. The current usage metrics is available 48-96 hours after online publication and is updated daily on week days.
Initial download of the metrics may take a while.