Fig. 6.
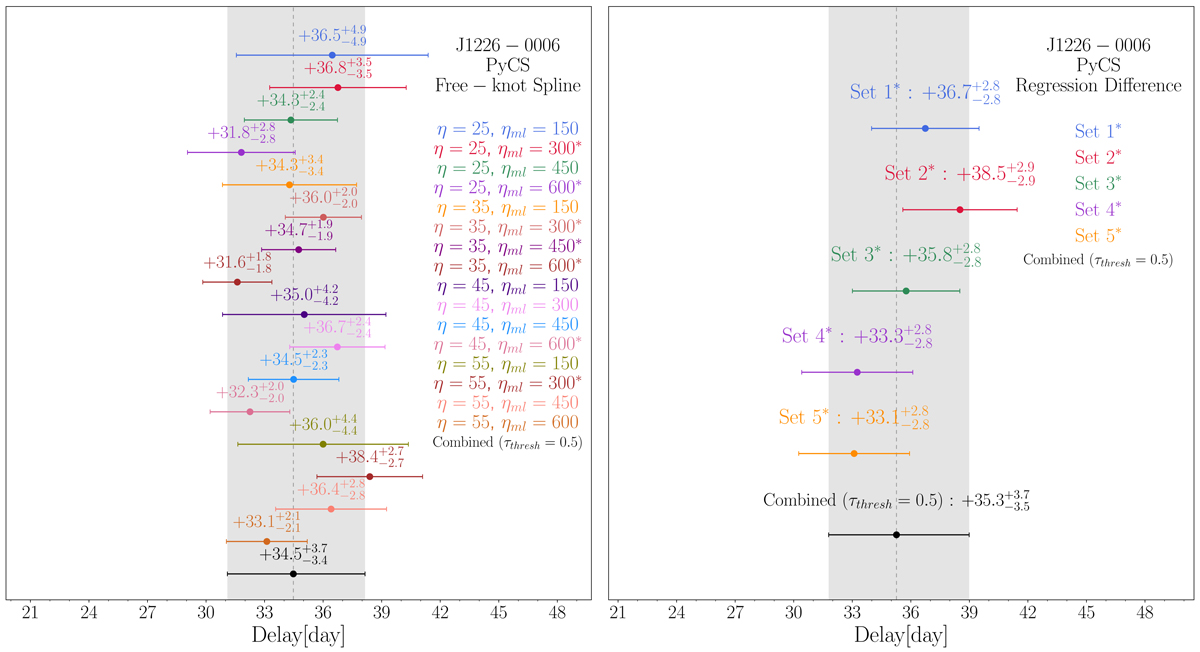
Illustration of how we combine groups of time-delay estimates in a series on the ECAM data set for the lensed quasar SDSS J1226−0006. Left panel: series of time-delay estimates obtained for the free-knot spline technique. Each time-delay estimate presented on the plot corresponds to a particular choice of estimator parameters for the mean spacing between the knots of the intrinsic spline η, and of the extrinsic splines ηml. The combined estimate is shown both in black at the bottom of the panel and in a grey shaded band, to visually ease the comparison with individual estimates and it corresponds to the combination described in Sect. 3.3 with τthresh = 0.5. The estimates used to produce this combination are marked with *. Right panel: series of time-delay estimates obtained with the regression difference technique. The sets of parameter are detailed in Table 2.
Current usage metrics show cumulative count of Article Views (full-text article views including HTML views, PDF and ePub downloads, according to the available data) and Abstracts Views on Vision4Press platform.
Data correspond to usage on the plateform after 2015. The current usage metrics is available 48-96 hours after online publication and is updated daily on week days.
Initial download of the metrics may take a while.