Fig. 5.
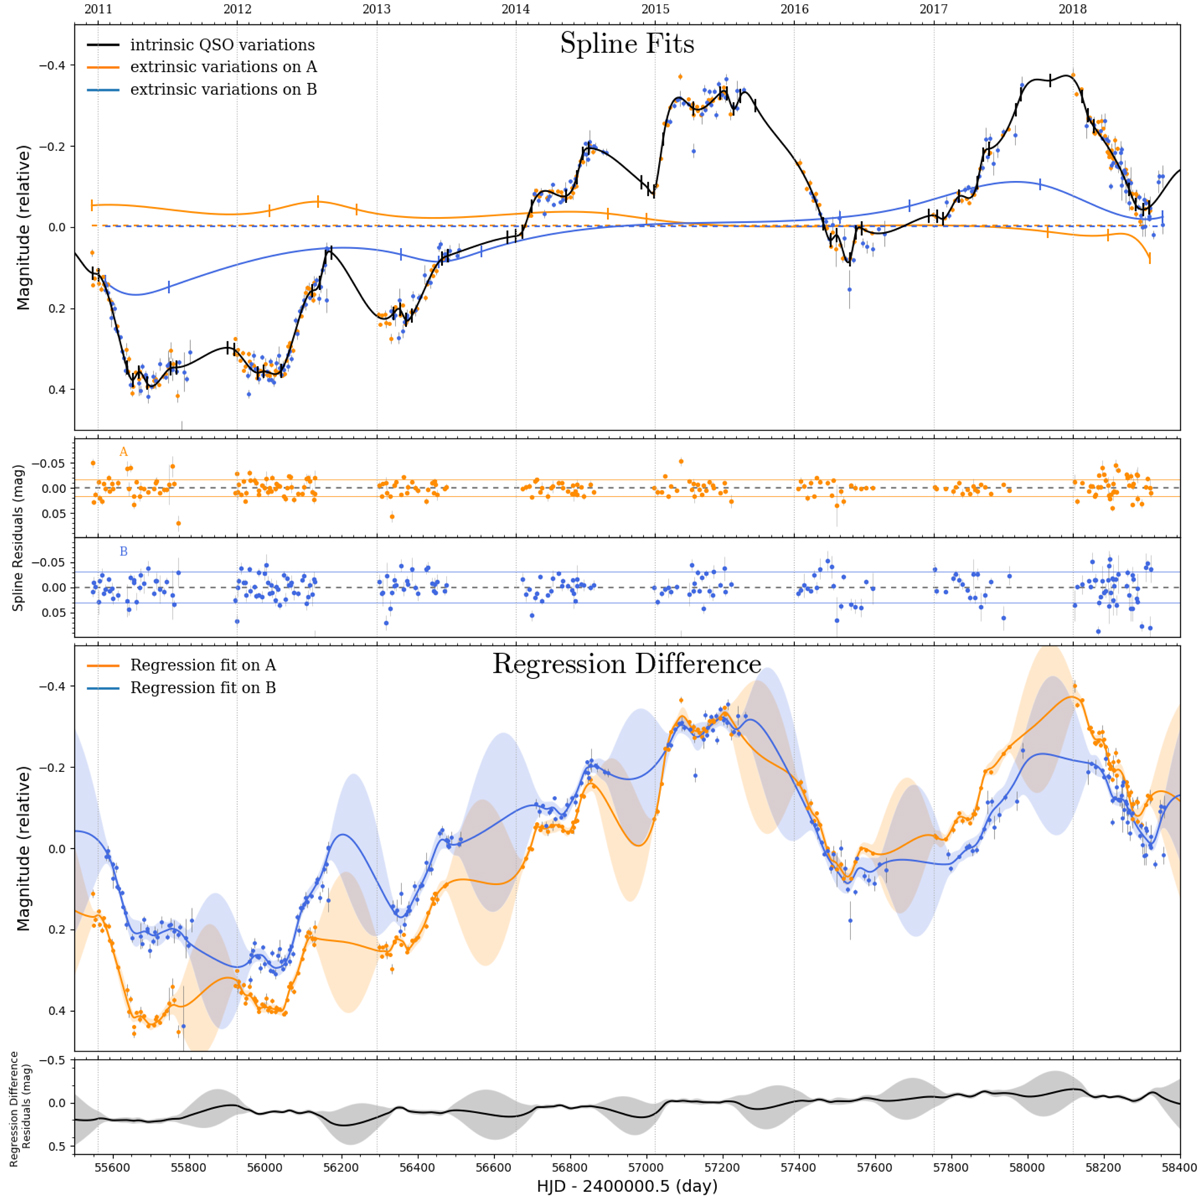
Top panel: spline fit of the ECAM data of SDSS J1226−0006. The black line represents the intrinsic variation shared by both curves (η = 45 days) whereas the blue and orange lines model the extrinsic variations of A and B, respectively (ηml = 300 days). The curves are shifted in time by the optimal time delay, and corrected from their modelled extrinsic variations. Middle panel: residuals of the spline fit. Bottom panel: regression fits using Gaussian processes and their 1σ envelopes. The difference curve between the regression curves fitted on image A and image B is also shown in black. The algorithm is optimising the time shift in order to minimise the variability in the difference curve.
Current usage metrics show cumulative count of Article Views (full-text article views including HTML views, PDF and ePub downloads, according to the available data) and Abstracts Views on Vision4Press platform.
Data correspond to usage on the plateform after 2015. The current usage metrics is available 48-96 hours after online publication and is updated daily on week days.
Initial download of the metrics may take a while.