Fig. 4.
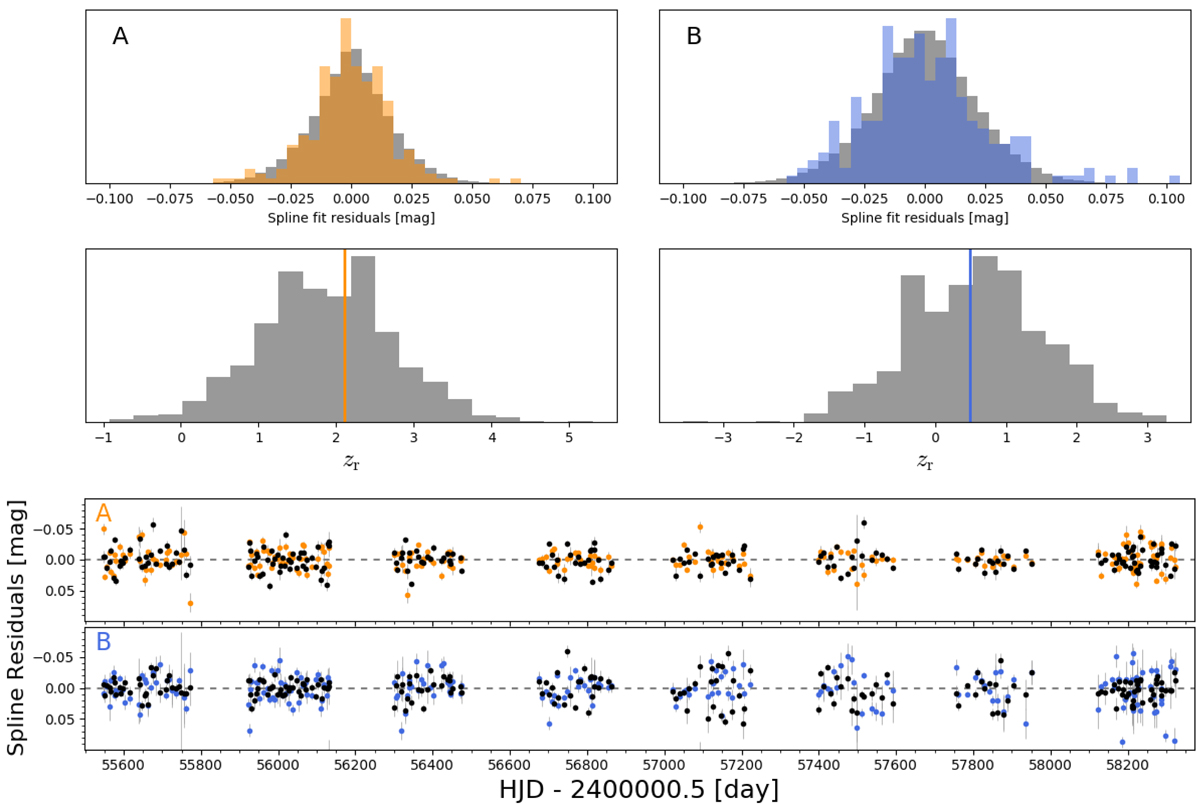
Top: distribution of the free-knot spline fit residuals for model parameter η = 45 days, ηml = 300 days in the ECAM light curves of SDSS J1226−0006. The orange and blue histograms represent the distributions of data residuals whereas the grey histogram corresponds to the distribution of the residuals for the 800 synthetic light curves created using the generative model. Middle panels: normalised number of runs zr for the synthetic curves (grey histogram) and for the data (orange and blue vertical lines). Bottom panels: residuals for the free-knot spline fit to the data, shown in blue and orange for images A and B, respectively. One example of the typical residuals obtained on applying the free-knot spline curve shifting technique on a simulated light curve is shown in black. Residuals are statistically similar to the observed data in terms of dispersion of the residuals, σ, and normalised number of runs, zr (Eq. (2)).
Current usage metrics show cumulative count of Article Views (full-text article views including HTML views, PDF and ePub downloads, according to the available data) and Abstracts Views on Vision4Press platform.
Data correspond to usage on the plateform after 2015. The current usage metrics is available 48-96 hours after online publication and is updated daily on week days.
Initial download of the metrics may take a while.