Fig. 2.
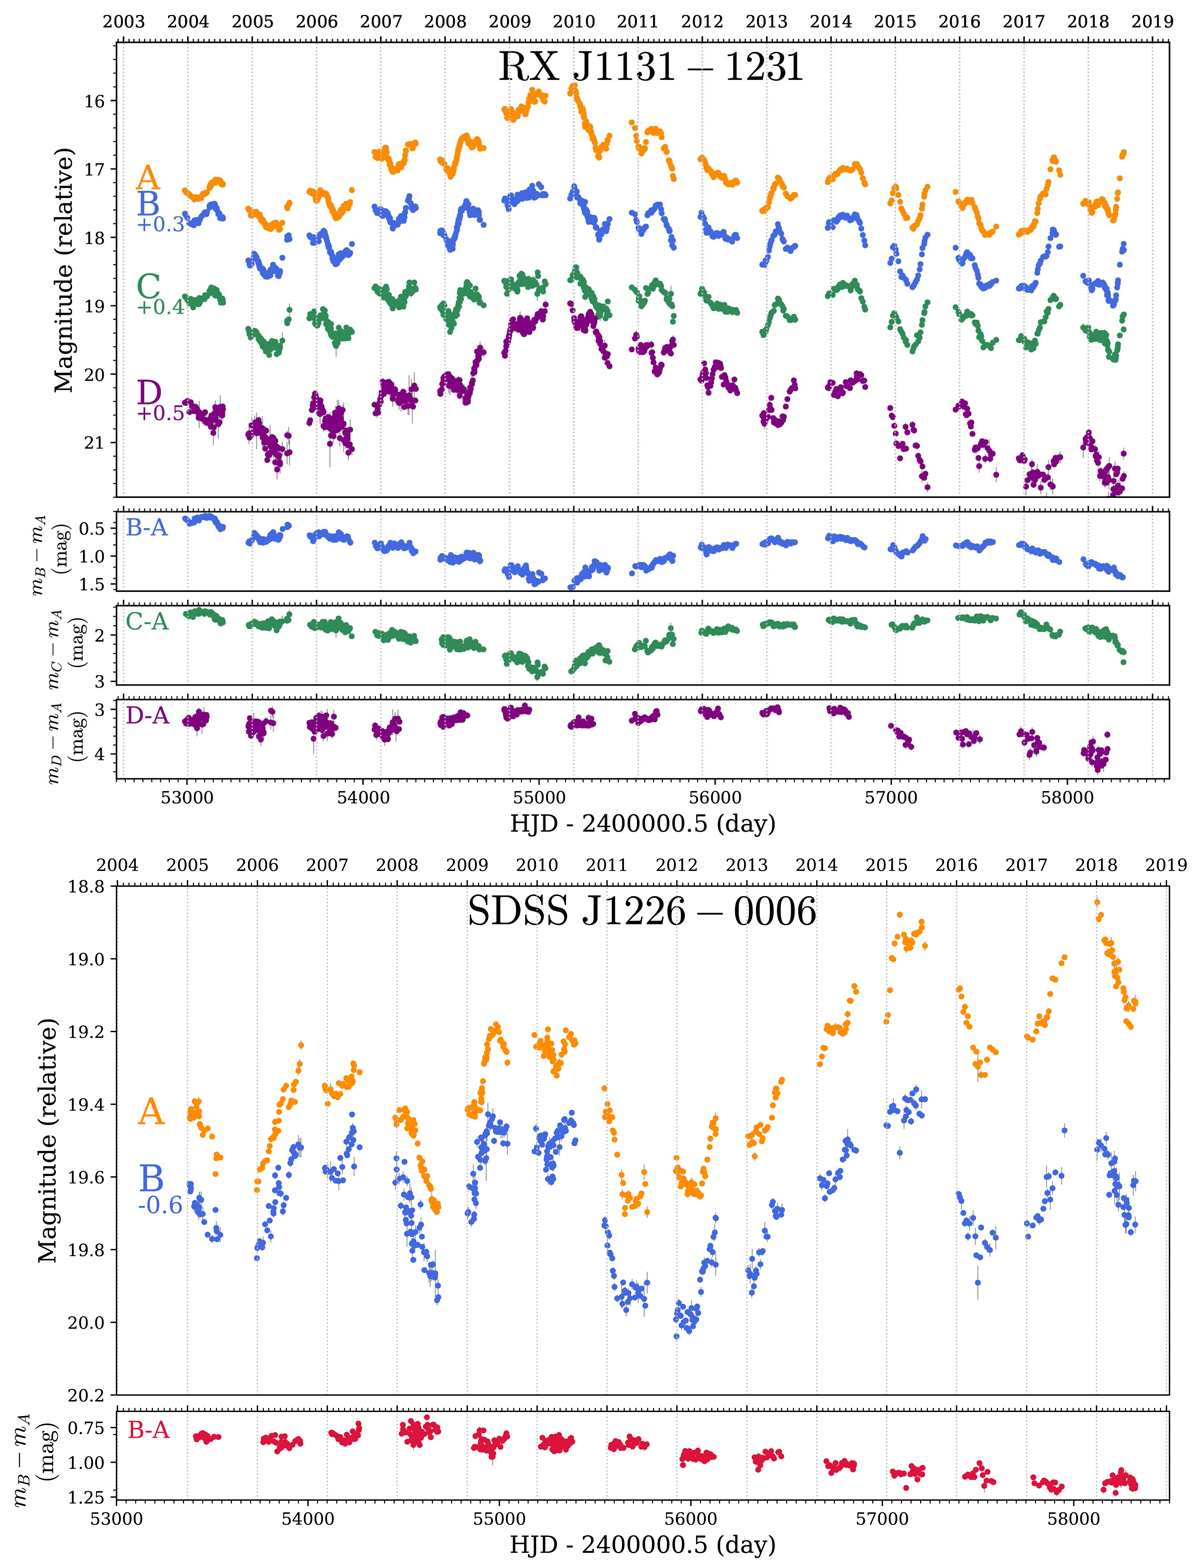
Full COSMOGRAIL R-band light curves for RX J1131−1231 and SDSS J1226−0006, as also summarised in Table 1. The bottom panels for each object show the difference curves between pairs of multiple images, shifted by the corresponding measured delay and interpolated with the intrinsic spline model fitted to the data (see Sect. 3). Light curves for all the other lensed quasars presented in this paper are shown in Appendix B (Fig. B.1).
Current usage metrics show cumulative count of Article Views (full-text article views including HTML views, PDF and ePub downloads, according to the available data) and Abstracts Views on Vision4Press platform.
Data correspond to usage on the plateform after 2015. The current usage metrics is available 48-96 hours after online publication and is updated daily on week days.
Initial download of the metrics may take a while.