Fig. 9.
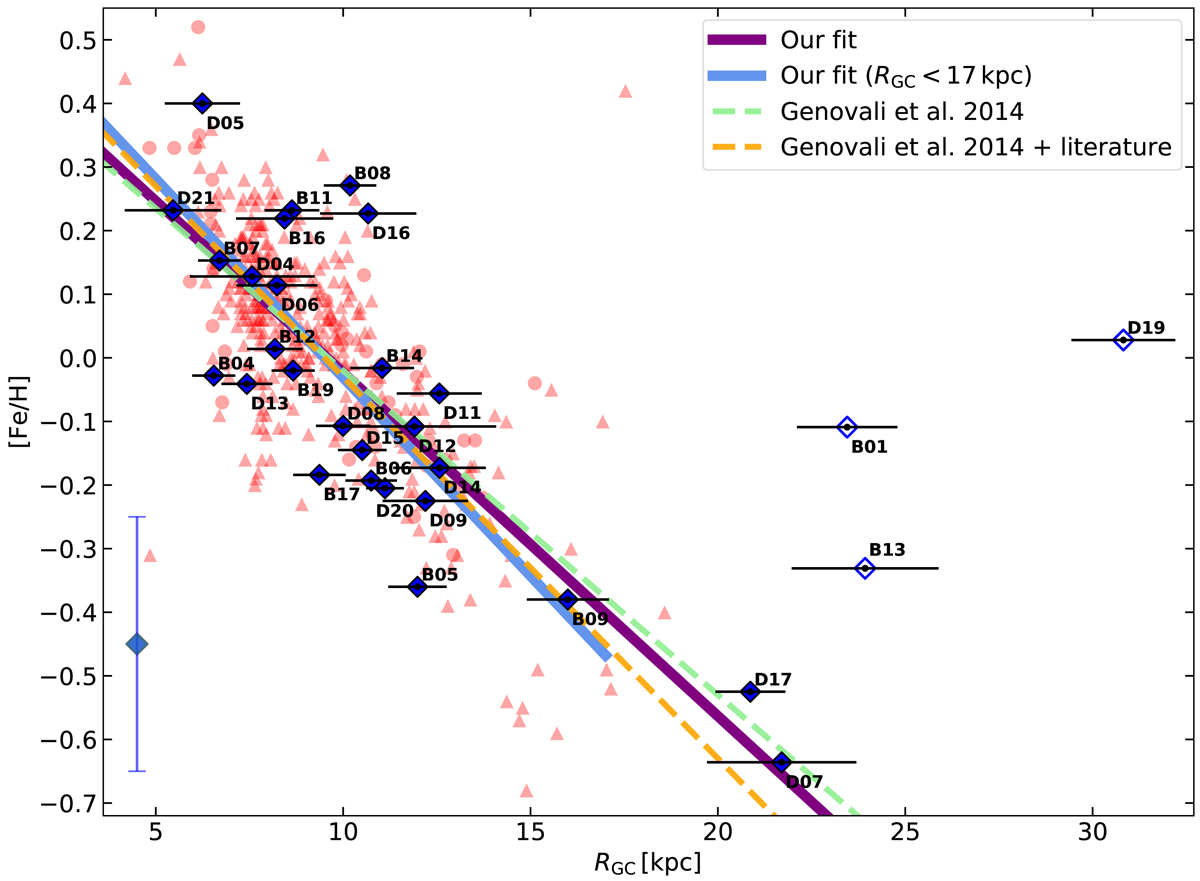
Iron abundance for the far disk CCs classified in this work as a function of their Galactocentric distance, plotted using filled blue diamonds. Open symbols are used for the same stars as in Fig. 8. The distances have been computed assuming AKs/E(J − Ks) = 0.465 and AKs/E(H − Ks) = 1.308. The error bars in the distances represent the total uncertainties calculated taking into account all the sources of uncertainty discussed in Sect. 2.5. The metallicity error bar is shown in the bottom left corner of the plot (σ[Fe/H] = 0.2 dex, see Sect. 7.2). The metallicity gradient measured by Genovali et al. (2014), based only on abundances provided by their group (red light circles), is shown as a light green dashed line; the orange dashed line is their fit including iron abundances for CCs available in the literature, which are plotted with red light triangles. The purple and light blue lines show the metallicity gradient on the far side of the Galactic disk as derived in this work, when using CCs in the whole range of RGC and for RGC ⪅ 17 kpc, respectively.
Current usage metrics show cumulative count of Article Views (full-text article views including HTML views, PDF and ePub downloads, according to the available data) and Abstracts Views on Vision4Press platform.
Data correspond to usage on the plateform after 2015. The current usage metrics is available 48-96 hours after online publication and is updated daily on week days.
Initial download of the metrics may take a while.