Fig. 8.
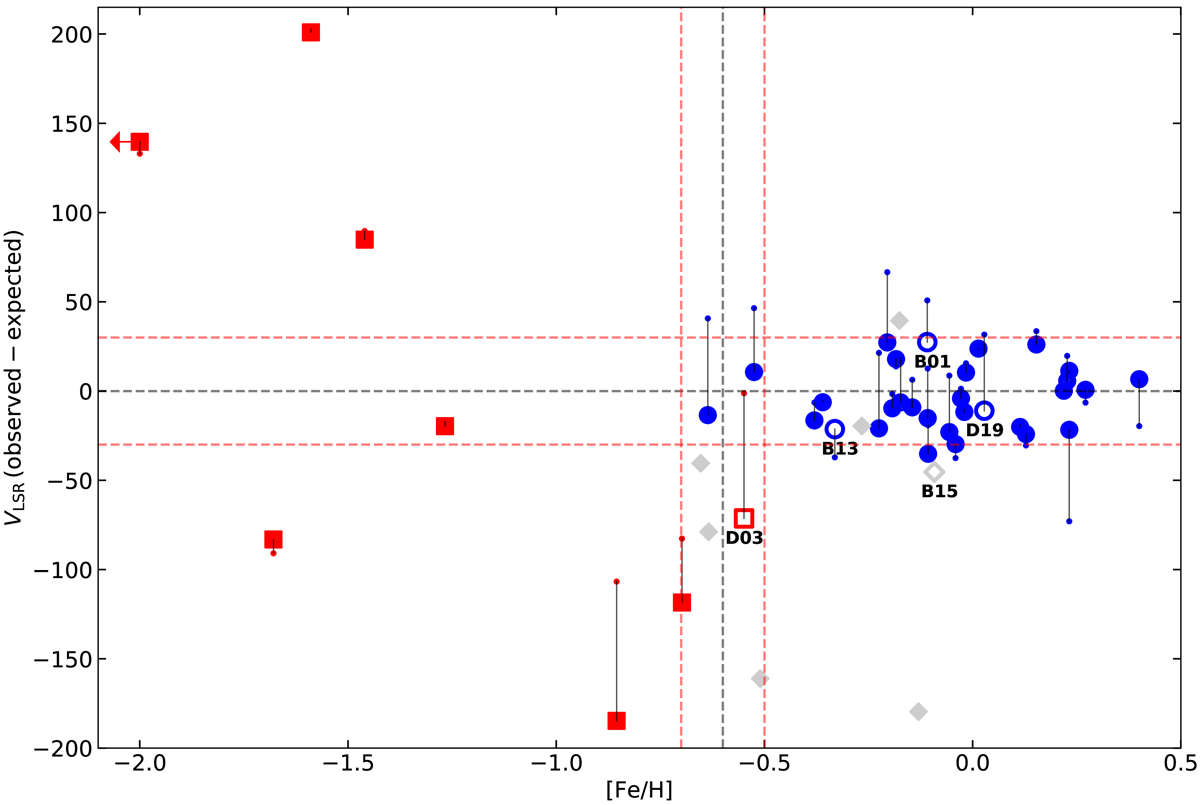
Difference between the observed VLSR and the expected VLSR (ΔVLSR) as a function of the metallicity [Fe/H], for the full sample of Cepheid candidates. The different markers indicate stars classified as CCs (blue circles), T2Cs (red squares), and low Teff for a Cepheid (gray diamonds). See the text for details about the five stars represented with open symbols. The horizontal red dashed lines indicate velocity differences of ΔVLSR = ±30 km s−1 and the black one ΔVLSR = 0 km s−1. The vertical black dashed line is [Fe/H] = −0.6 dex and the ±0.1 dex region is indicated with the vertical red dashed lines. There is a clear difference between CCs and T2Cs. Also included as a reference are the observed VLSR on the y-axis (small points, connected with black lines to their ΔVLSR values). For the stars classified as CCs the dispersion around ΔVLSR = 0 km s−1 decreases, thus compatible with having disk-like kinematics; instead, T2Cs show large ΔVLSR.
Current usage metrics show cumulative count of Article Views (full-text article views including HTML views, PDF and ePub downloads, according to the available data) and Abstracts Views on Vision4Press platform.
Data correspond to usage on the plateform after 2015. The current usage metrics is available 48-96 hours after online publication and is updated daily on week days.
Initial download of the metrics may take a while.