Fig. 3.
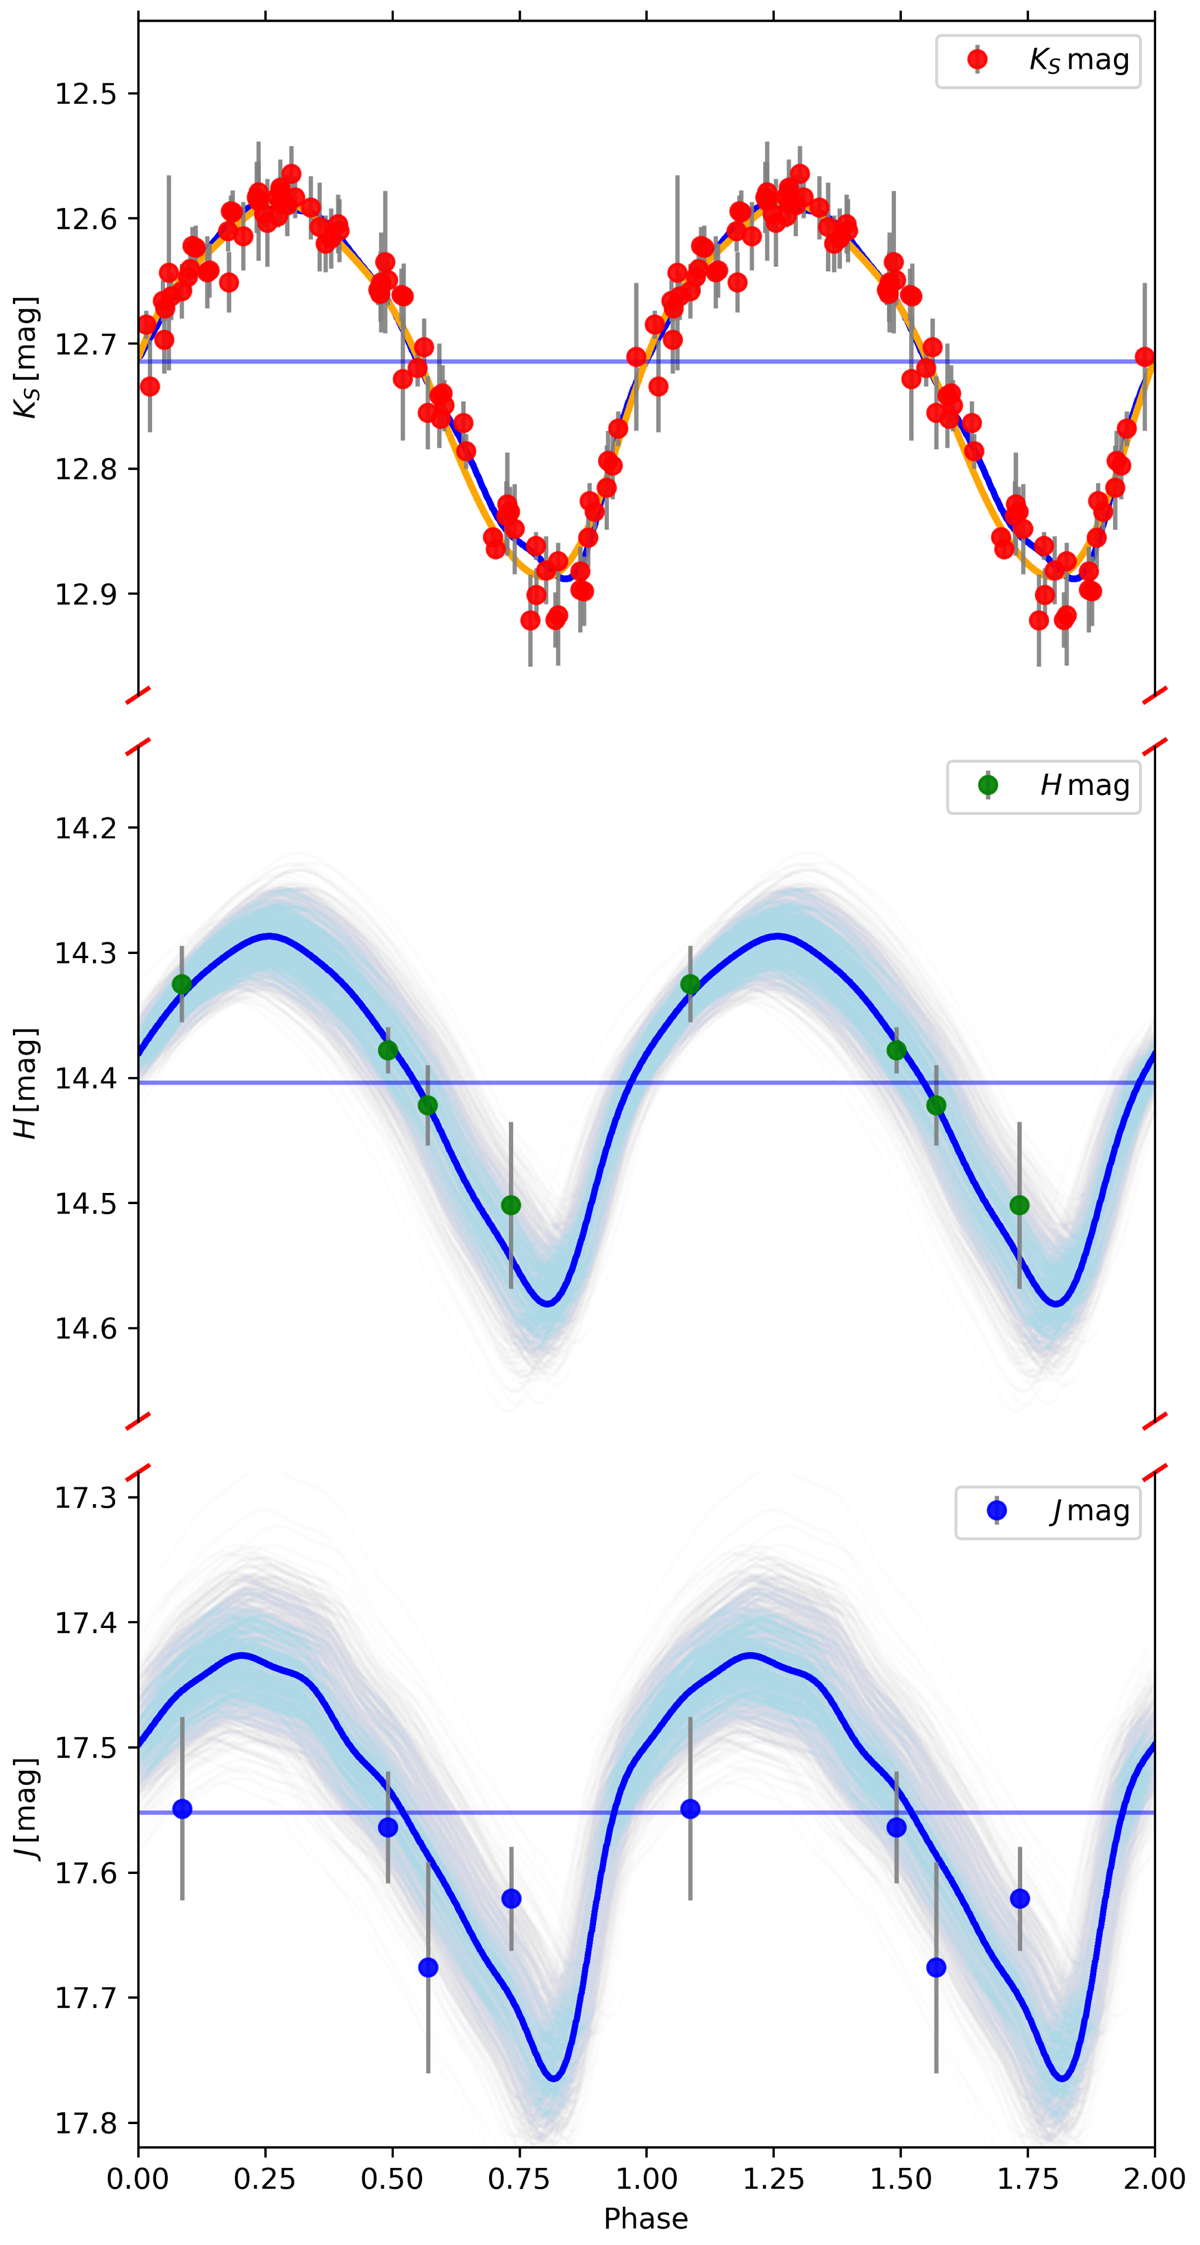
Light curve fitting for B01 using I15 H- (middle) and J-band (bottom) templates. Also shown are the Ks-band light curve (top) together with the best-fit Fourier series (orange curve) and the corresponding I15 template (blue curve), which are almost indistinguishable from each other. The horizontal blue lines indicate the mean magnitude for each band.
Current usage metrics show cumulative count of Article Views (full-text article views including HTML views, PDF and ePub downloads, according to the available data) and Abstracts Views on Vision4Press platform.
Data correspond to usage on the plateform after 2015. The current usage metrics is available 48-96 hours after online publication and is updated daily on week days.
Initial download of the metrics may take a while.