Fig. 10.
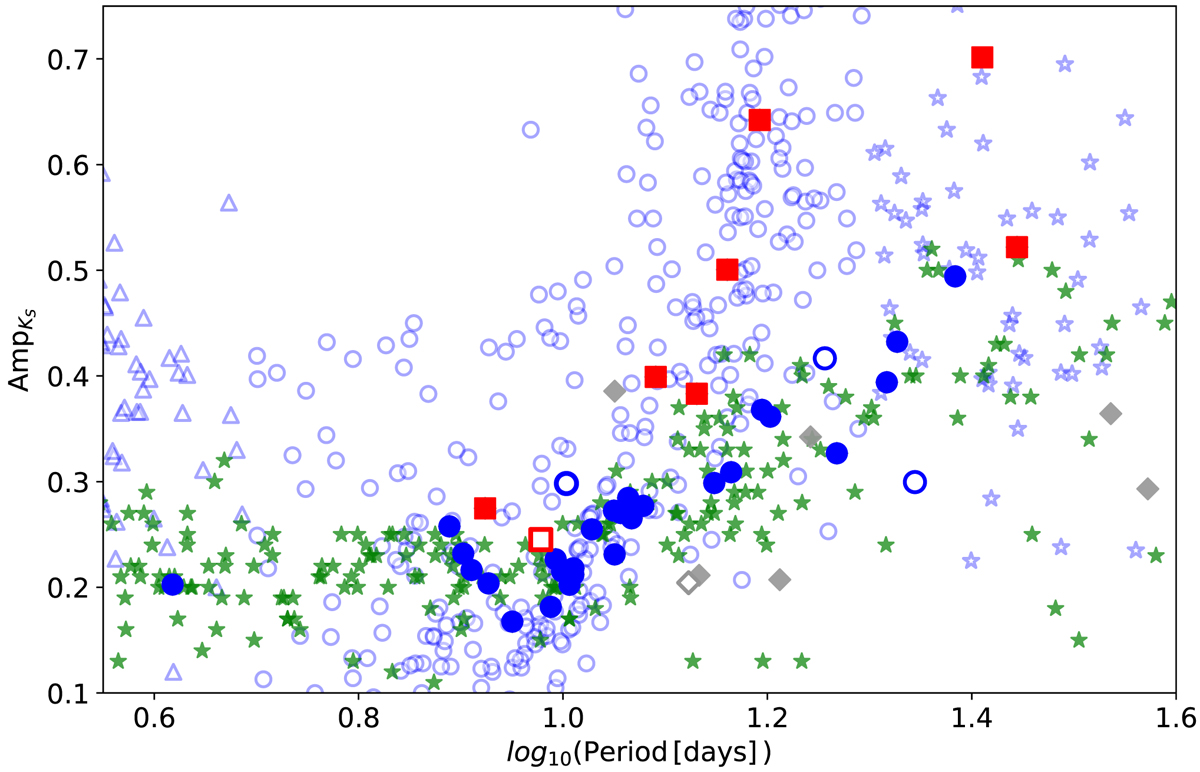
Position of the sample of candidate Cepheids in the Bailey diagram, now classified as CCs (blue circles) and T2Cs (red squares). In the background, other well-known CCs (light green stars) and T2Cs in the MW (light blue open symbols) are plotted. Literature T2Cs are divided into the three main subtypes described in Fig. 1. The gray diamonds indicate stars whose Teff values are too low to be Cepheids.
Current usage metrics show cumulative count of Article Views (full-text article views including HTML views, PDF and ePub downloads, according to the available data) and Abstracts Views on Vision4Press platform.
Data correspond to usage on the plateform after 2015. The current usage metrics is available 48-96 hours after online publication and is updated daily on week days.
Initial download of the metrics may take a while.