Fig. 1.
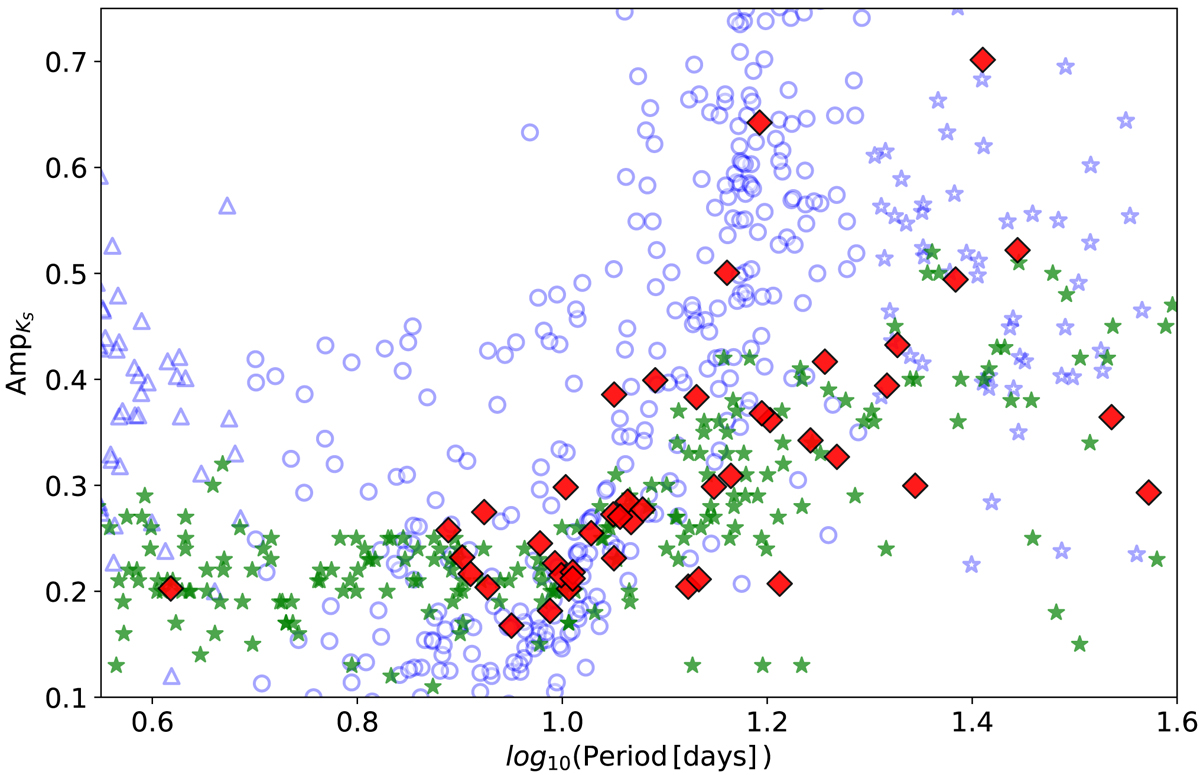
Bailey diagram in Ks band, showing amplitude vs. period, for our Cepheid candidate sample (red diamonds contoured in black) together with other well-known CCs (light green stars) and T2Cs (light blue open symbols). T2Cs are divided into the three main subtypes (see text). The open triangles, circles, and stars represent BL Her, W Vir, and RV Tau stars, respectively. Literature CCs come from the compilation by Inno et al. (2015) and T2Cs from Braga et al. (2018). The classification of this comparison sample is based on optical data, and is therefore more accurate than those based on near-IR data.
Current usage metrics show cumulative count of Article Views (full-text article views including HTML views, PDF and ePub downloads, according to the available data) and Abstracts Views on Vision4Press platform.
Data correspond to usage on the plateform after 2015. The current usage metrics is available 48-96 hours after online publication and is updated daily on week days.
Initial download of the metrics may take a while.