Fig. 16.
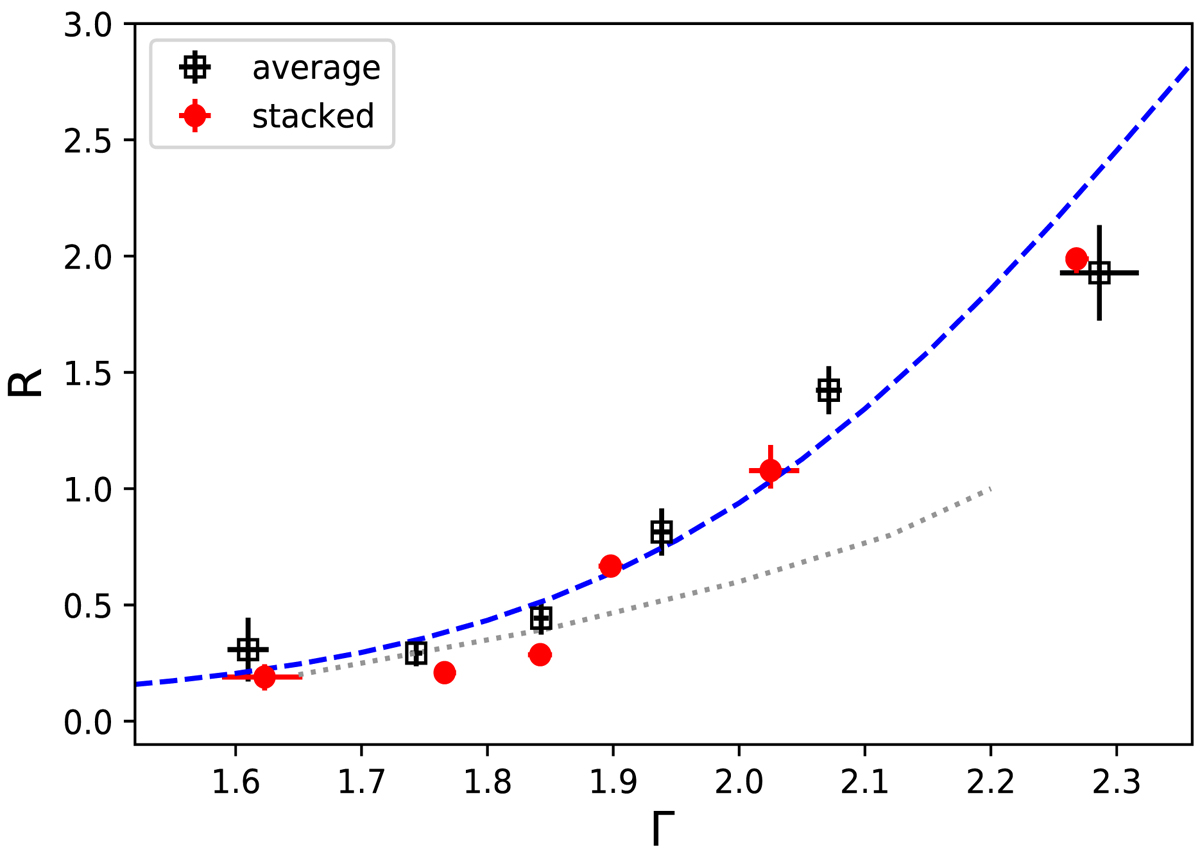
Observed R − Γ correlation for the subgroups of UNOB class. The red filled circles correspond to the best-fit values of the stacked spectra, while the black open squares to the average values of the individual best fits. The errors are not distinguishable because of their small value. The dashed blue line indicates the correlation expected for a moving corona with respect to the disc (Beloborodov 1999) and the dotted gray line indicates the correlation predicted for a variable covering disc factor.
Current usage metrics show cumulative count of Article Views (full-text article views including HTML views, PDF and ePub downloads, according to the available data) and Abstracts Views on Vision4Press platform.
Data correspond to usage on the plateform after 2015. The current usage metrics is available 48-96 hours after online publication and is updated daily on week days.
Initial download of the metrics may take a while.