Free Access
Fig. 15.
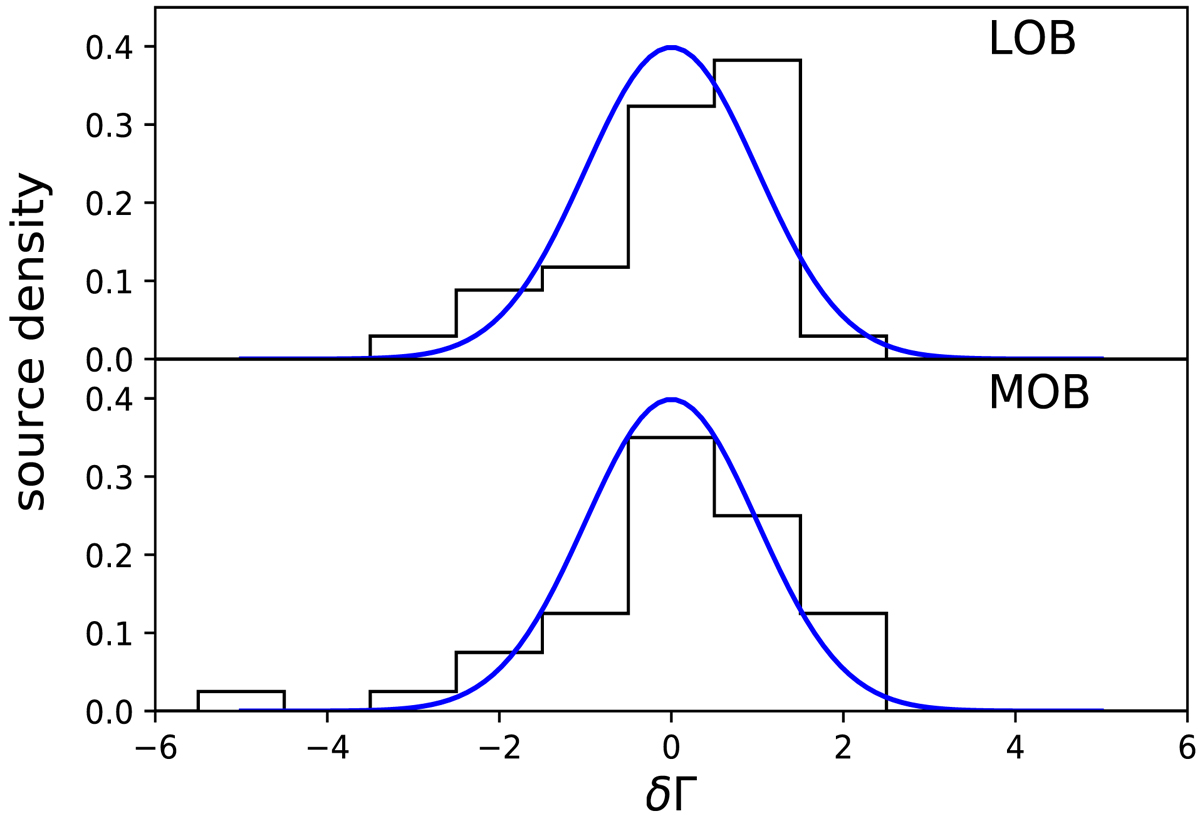
δΓ normalised histogram. One LOB (upper panel) and one MOB (lower panel) source lie outside the plotting range. The blue solid line is the same in both panels and corresponds to the standard normal distribution.
Current usage metrics show cumulative count of Article Views (full-text article views including HTML views, PDF and ePub downloads, according to the available data) and Abstracts Views on Vision4Press platform.
Data correspond to usage on the plateform after 2015. The current usage metrics is available 48-96 hours after online publication and is updated daily on week days.
Initial download of the metrics may take a while.