Fig. 12.
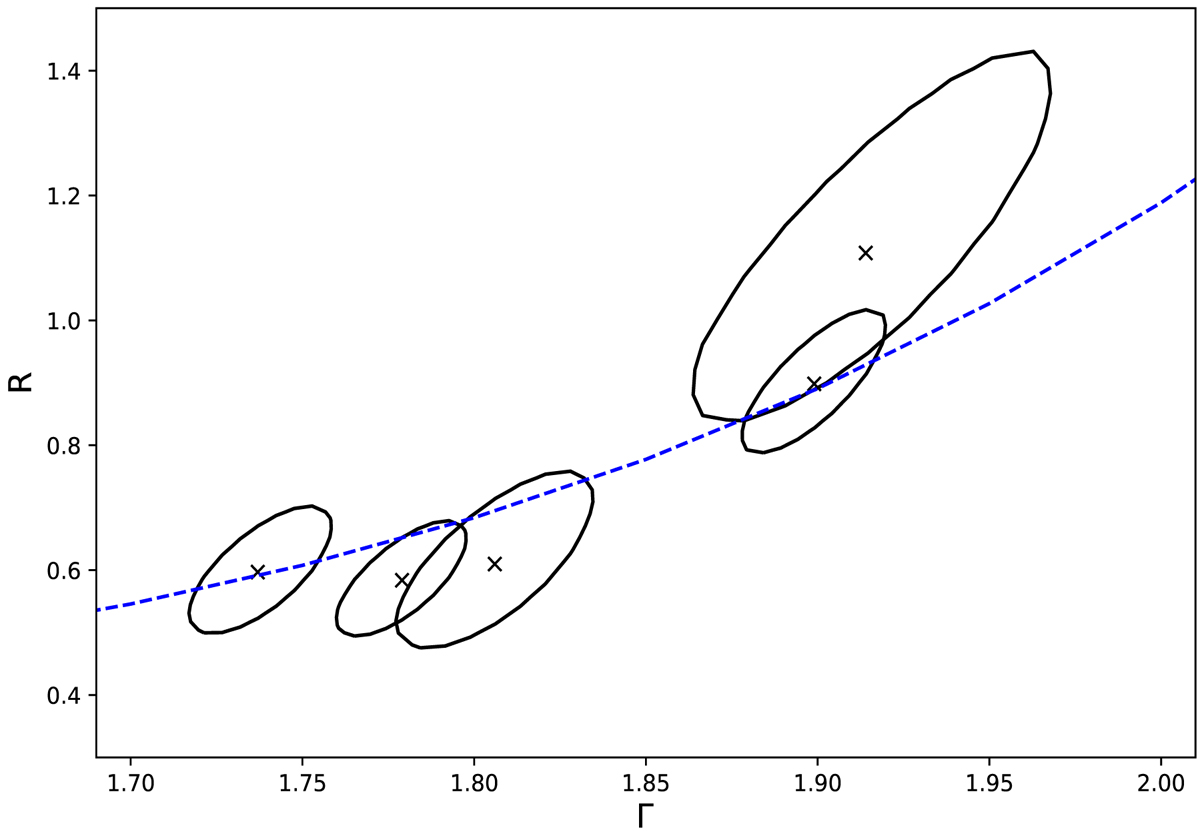
R − Γ correlation in Swift J0947.6-3057. The x symbols indicate the best-fit values, while the error contours correspond to a 99% confidence level (Δχ2 = 9.21). The dashed blue line indicates the correlation expected for a moving corona (Sect. 5.2). It is similar to the one plotted in Fig. 16, but a constant of R = 0.25 has been added to it.
Current usage metrics show cumulative count of Article Views (full-text article views including HTML views, PDF and ePub downloads, according to the available data) and Abstracts Views on Vision4Press platform.
Data correspond to usage on the plateform after 2015. The current usage metrics is available 48-96 hours after online publication and is updated daily on week days.
Initial download of the metrics may take a while.