Fig. 21.
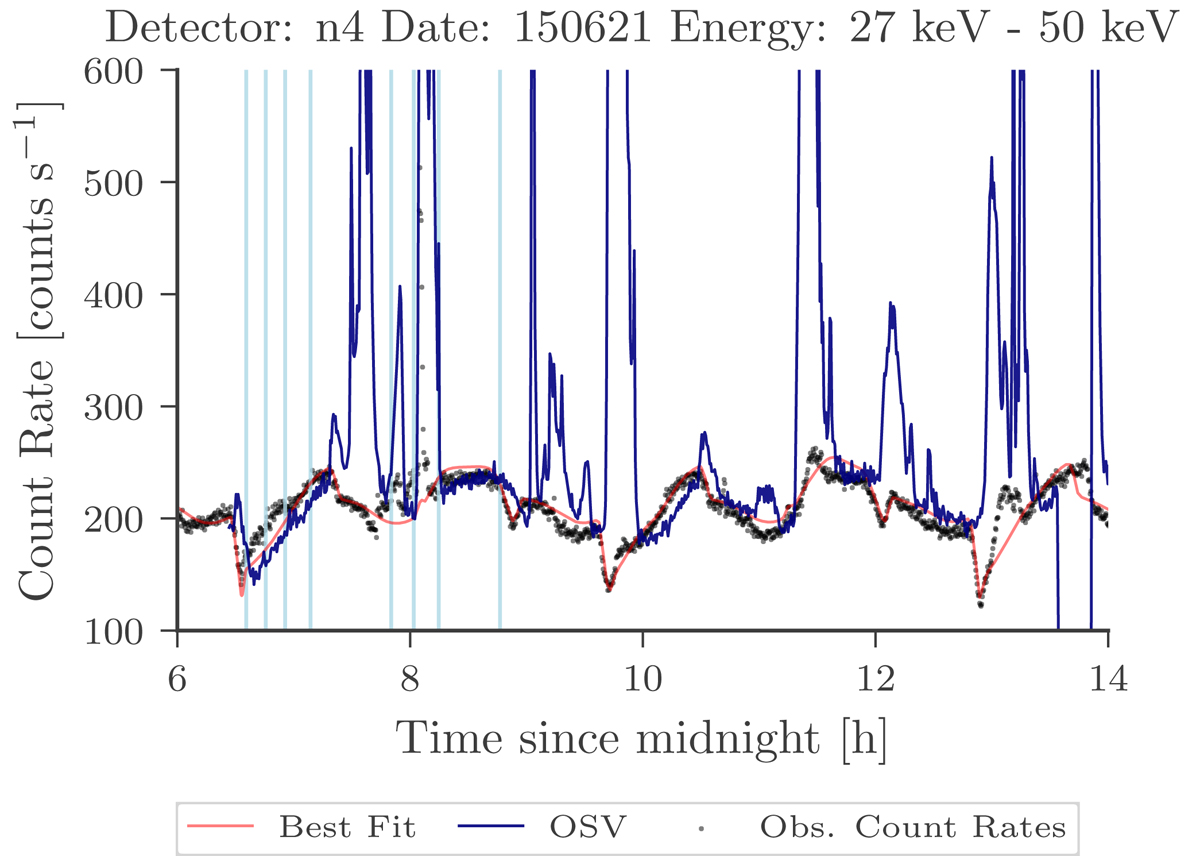
Data (black), background fit (red), and background estimation (OSV, dark blue) with the OSV for part of 21 June 2015 during the 2015 V404 Cygni outburst, detector n9 and reconstructed energy between 27 keV and 50 keV. All GBM triggers during this time are shown as blue vertical lines (before the onboard triggers were turned off).
Current usage metrics show cumulative count of Article Views (full-text article views including HTML views, PDF and ePub downloads, according to the available data) and Abstracts Views on Vision4Press platform.
Data correspond to usage on the plateform after 2015. The current usage metrics is available 48-96 hours after online publication and is updated daily on week days.
Initial download of the metrics may take a while.