Fig. 20.
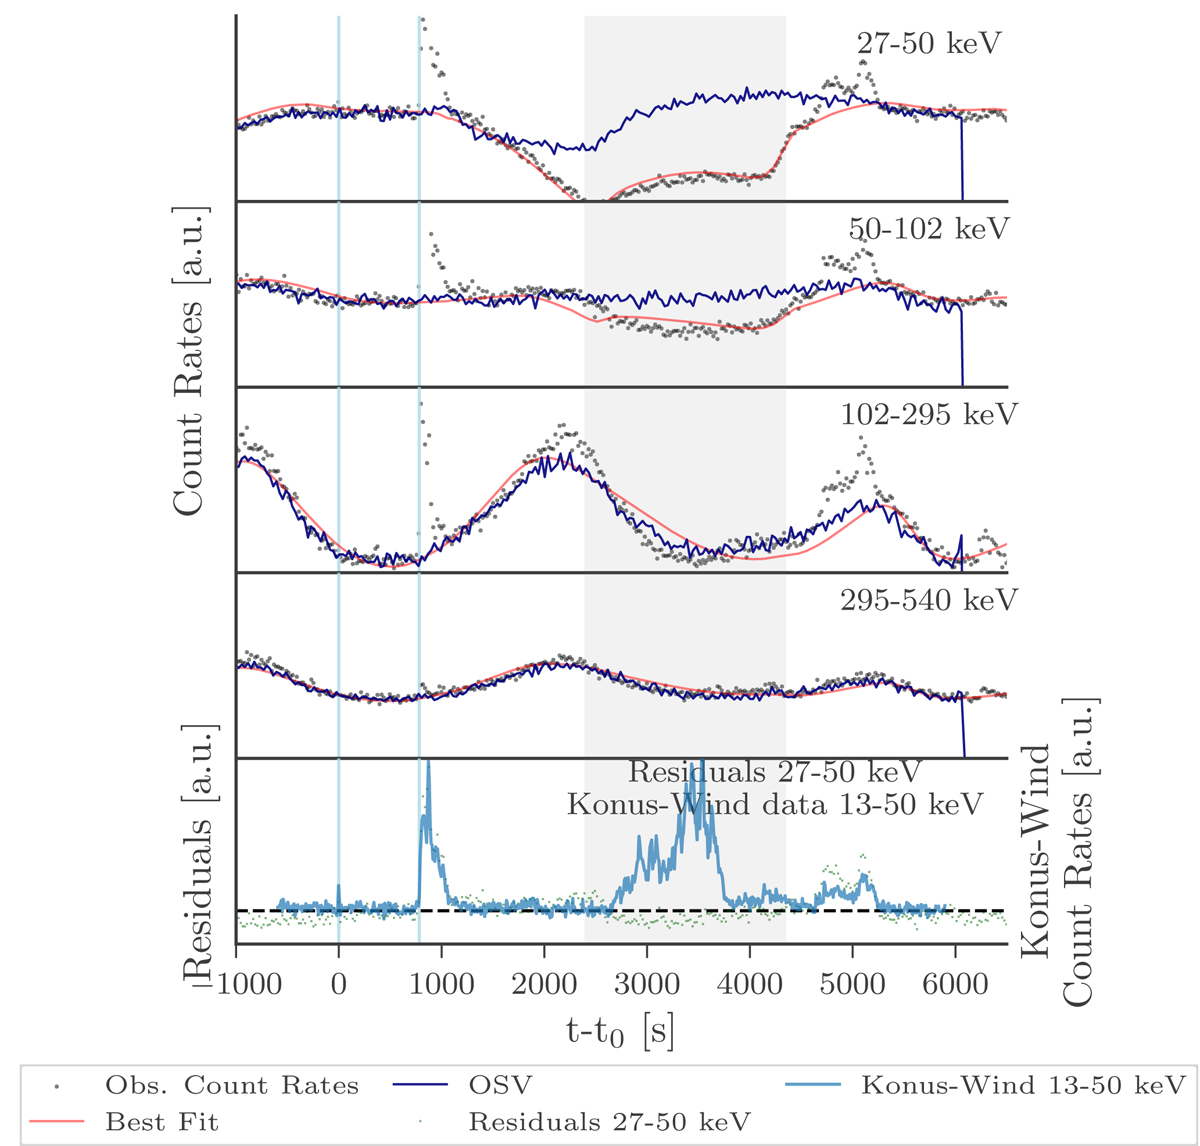
Data (black), background fit (red), and background estimation (OSV, dark blue) with the OSV (Fitzpatrick et al. 2012) for the emission time of 130925A, detector n9 and 4 reconstructed energy ranges in the top 4 panels. In the bottom panel the residuls for the background fit between 27 keV and 50 keV reconstructed energy are given, as well as the background subtracted Konus-Wind data between 13 keV and 50 keV (Golenetskii et al. 2013). The two blue vertical lines show the time of the two GBM triggers for GRB 130925A and the gray area the time during which the position of GRB 130925A was occulted by the earth for GBM.
Current usage metrics show cumulative count of Article Views (full-text article views including HTML views, PDF and ePub downloads, according to the available data) and Abstracts Views on Vision4Press platform.
Data correspond to usage on the plateform after 2015. The current usage metrics is available 48-96 hours after online publication and is updated daily on week days.
Initial download of the metrics may take a while.