Fig. 19.
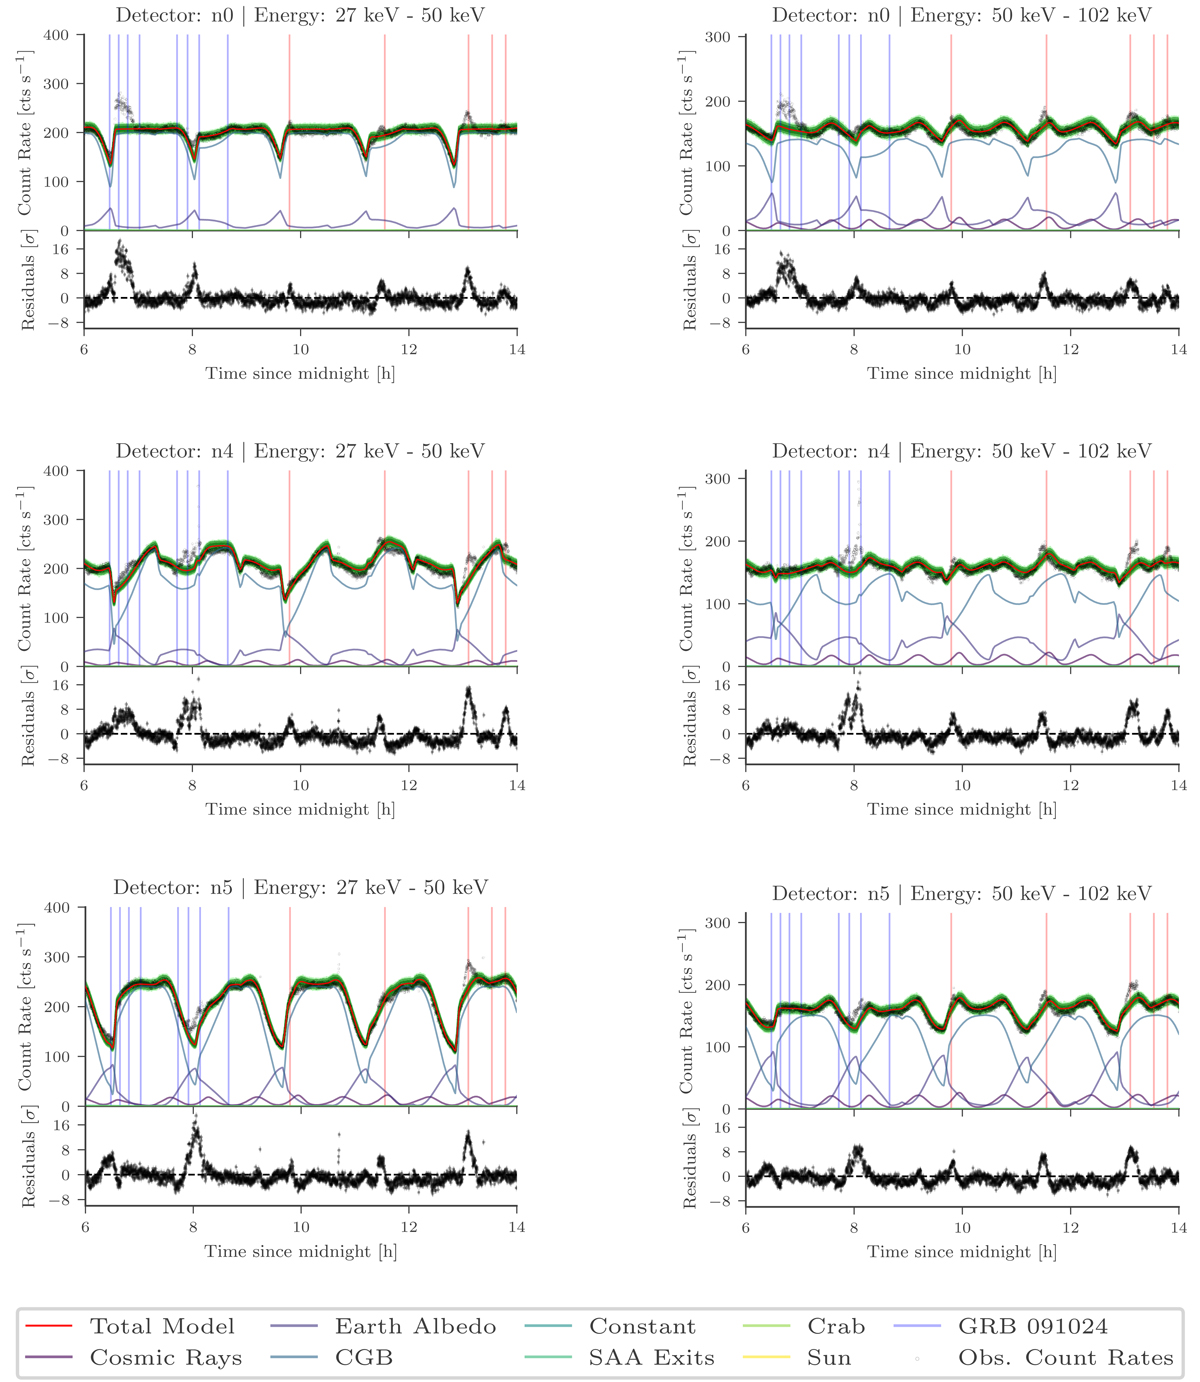
Data and background fits for part of the 21 June 2015, which was during a V404 Cygni outburst for 3 different detectors (n0 (top), n4 (middle), n5 (bottom)) and 2 reconstructed energy ranges (27–50 keV (left) and 50–102 keV (right)). The blue vertical lines indicate GBM trigger times, whereas the red vertical lines indicate possible new emission events that did not trigger GBM.
Current usage metrics show cumulative count of Article Views (full-text article views including HTML views, PDF and ePub downloads, according to the available data) and Abstracts Views on Vision4Press platform.
Data correspond to usage on the plateform after 2015. The current usage metrics is available 48-96 hours after online publication and is updated daily on week days.
Initial download of the metrics may take a while.